
Crypto Value in the Digital Market: What It Actually Means and How It Works in 2026
Most people confuse price with value in crypto — and that mistake costs them money. A coin priced at $0.001 is not cheaper or a better deal than Bitcoin at $90,000. Understanding how crypto value actually works in the digital market is the difference between making informed decisions and gambling blindly. Here is the complete, practical breakdown — from how market value is calculated to what actually drives it up or down, and what to watch before touching any crypto asset.
The Crypto Digital Market Right Now (March 2026)
| Metric | Current Figure |
|---|---|
| Global crypto market cap | $2.41 trillion |
| Bitcoin dominance | 57.07% |
| Ethereum dominance | 9.97% |
| Stablecoin market cap | $310 billion (12.88% of total) |
| Total cryptocurrencies tracked | 17,392 |
| 24-hour trading volume | $93 billion |
| Bitcoin ETF assets | $117 billion |
| Ethereum ETF assets | $19.1 billion |
Source: CoinGecko, March 7, 2026
The market is currently down 21.39% from one year ago. That context matters before anything else.
What Does “Crypto Value in the Digital Market” Actually Mean?
Quick answer: Crypto value in the digital market refers to the total worth of a cryptocurrency — measured not just by its price per coin, but by its market capitalization, real-world utility, and the demand behind it. Price alone tells you almost nothing.
This is the most misunderstood thing in crypto, so let’s fix it with a clear example.
Imagine two coins:
- Coin A: Priced at $90,000 per coin. 19.6 million coins in circulation. That’s Bitcoin — total market value: $1.76 trillion.
- Coin B: Priced at $0.001 per coin. 5 trillion coins in circulation. Total market value: $5 billion.
Coin B looks “cheaper.” But its total market value is $5 billion — it’s already a significant asset. For Coin B to double in price, $5 billion of new money needs to flow in. For a truly tiny coin priced at $0.001 with $10 million market cap, only $10 million of new demand doubles your money — but it can also disappear just as fast.
This is why price per coin is meaningless. Market capitalization is what matters.
How Is Crypto Market Value Calculated?
Quick answer: Market cap = price of one coin × number of coins currently in circulation. But there are three different supply numbers, and using the wrong one leads to bad decisions.
The formula is simple. The confusion comes from which supply number you use.
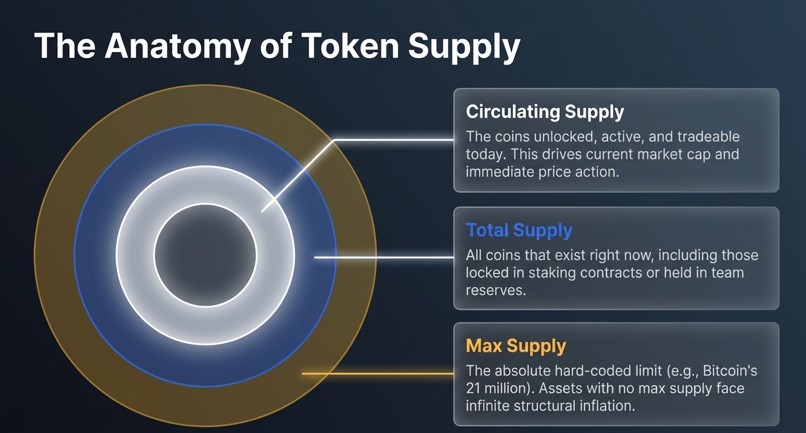
Circulating Supply — coins that are currently unlocked, tradeable, and active in the market. This is the number used to calculate standard market cap. It’s the most relevant figure for current price analysis.
Total Supply — all coins that exist, including ones locked up, staked, or held in reserve by the founding team. This number is always higher than circulating supply.
Max Supply — the absolute hard limit of coins that will ever exist. Bitcoin’s max supply is 21 million. Some coins have no max supply — meaning new coins can be created indefinitely, which dilutes existing holders over time.
Fully Diluted Market Cap (FDV) — this is what the total market cap would be if every possible coin (including locked, unvested, and future coins) were in circulation at today’s price.
Here is why FDV matters and why beginners ignore it at their peril:
Imagine a new crypto project. It has 100 million coins in circulation today, priced at $1 each. Market cap = $100 million. Looks manageable. But its total max supply is 10 billion coins — only 1% is currently circulating. The fully diluted market cap is $10 billion. As those remaining 9.9 billion coins unlock over the next three years and hit the market, they create constant sell pressure. Early investors and team members dump their vested tokens. The price gradually gets crushed.
What to do: Always check both circulating market cap AND fully diluted market cap before evaluating any coin. If FDV is 10x or more than current market cap, that’s a serious red flag — enormous supply is waiting to unlock.
What not to do: Never judge a crypto’s value by its circulating market cap alone. Projects with low circulating supply can look cheap while massive future inflation is priced nowhere into the current number.
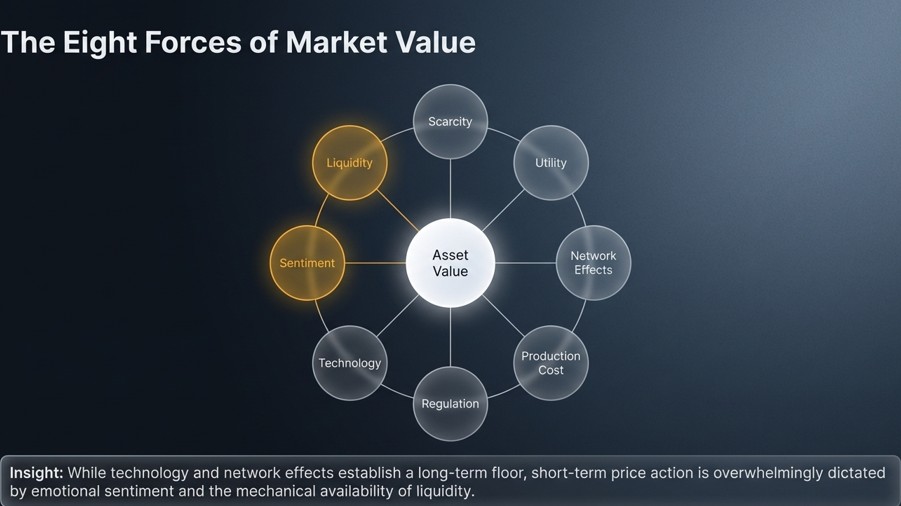
What Actually Drives Crypto Value Up or Down?
Quick answer: Eight core forces drive crypto value — scarcity, utility, network effects, production cost, regulation, market sentiment, technology, and tokenomics. Most price swings come from just two: sentiment and liquidity. Here is how each one works practically.
1. Scarcity — The Bitcoin Model
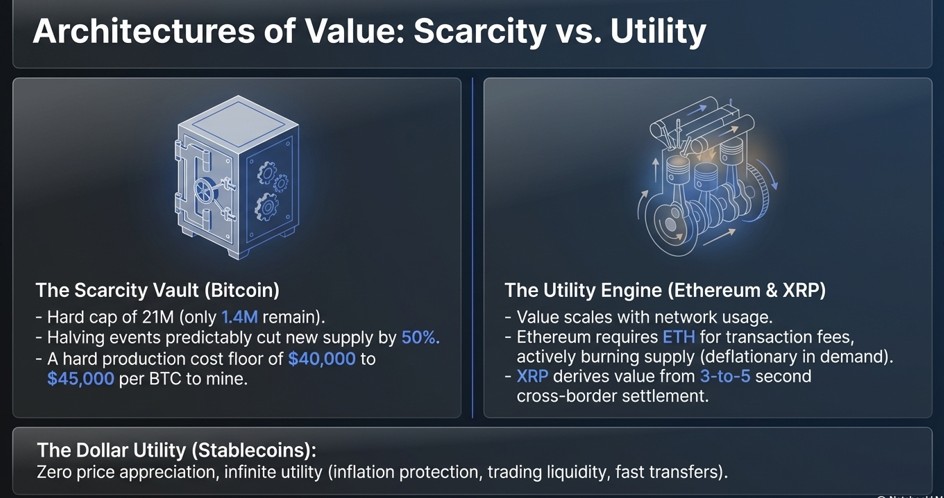
Bitcoin has a hard cap of 21 million coins. That’s it. No government, no company, no programmer can change that number — it’s written into the protocol’s code. As of March 2026, approximately 19.6 million Bitcoin have been mined. Only 1.4 million remain.
Every four years, a “halving” event cuts the rate of new Bitcoin creation in half. The most recent halving happened in April 2024. Before it: miners earned 6.25 BTC per block. After it: 3.125 BTC per block. Less new supply entering the market while demand stays flat or rises = upward price pressure.
This is a mathematical, predictable scarcity model. No other asset — gold included — has supply rules this transparent and immutable.
Ethereum is different. ETH has no hard cap, but it uses a burn mechanism — a portion of every transaction fee is permanently destroyed. In high-demand periods, Ethereum burns more ETH than it creates. This makes it deflationary in practice, even without a fixed limit.https://thedawncrypto.com/how-interest-rate-hikes-impact-bitcoin-prices/
2. Utility — Does Anyone Actually Use It?
Value without use is speculation. Value with genuine use is sustainable.
Bitcoin’s primary utility is as a store of value — digital gold that’s resistant to seizure, censorship, and inflation. More than $117 billion is now locked in Bitcoin ETFs by institutional investors who use it exactly this way.
Ethereum’s utility is as a programmable platform. Developers build applications — DeFi protocols, NFT markets, stablecoins — on Ethereum. Each of those apps needs ETH to pay transaction fees. More apps = more ETH demand = more value pressure upward.
XRP’s utility is cross-border payment settlement — converting one currency to another in 3 to 5 seconds at near-zero cost. If international banks adopt it at scale, demand for XRP as a settlement bridge rises proportionally.
USDT (Tether) and USDC are stablecoins — their utility is being dollar-equivalent on the blockchain. They don’t appreciate in price, but their utility is enormous: protecting savings from inflation, enabling fast transfers, and providing trading liquidity.
The practical test: Before buying any crypto, ask — what is this coin actually used for today, not just promised for the future? If the only answer is “people buy it hoping it goes up,” that’s pure speculation with no floor.https://thedawncrypto.com/top-10-cryptocurrencies-to-invest-in-2025/.
3. Network Effects — The More Users, the More Value
The more people use a blockchain, the more valuable it becomes.
This is the same principle behind why WhatsApp became dominant — its value grows as more people join because the network itself becomes more useful. Bitcoin is valuable partly because hundreds of millions of people globally recognize and accept it. A brand new coin, even with better technology, starts from zero network effect.
In 2026, Bitcoin’s $1.37 trillion market cap reflects 15 years of accumulated network trust — thousands of exchanges, hundreds of ETF products, millions of wallets, and deep institutional recognition. That network effect doesn’t disappear in a bear market.
4. Production Cost — Bitcoin’s Price Floor
Mining Bitcoin requires specialized computers (ASICs — Application-Specific Integrated Circuits) and large amounts of electricity. The average cost to mine one Bitcoin is currently estimated between $40,000 and $45,000. This creates a soft price floor — when Bitcoin trades near mining cost, miners shut down unprofitable operations, supply growth slows, and price tends to stabilize.
This production cost model doesn’t apply to all cryptocurrencies. Proof-of-Stake coins like Ethereum, Cardano, and Solana don’t use mining. Their “cost” is the opportunity cost of staked capital, which is different and harder to quantify as a price floor.
5. Market Sentiment — The Biggest Short-Term Driver
In the short term, price is driven more by feeling than by fundamentals. Fear and greed move markets.
The Crypto Fear & Greed Index measures market sentiment on a scale of 0 (Extreme Fear) to 100 (Extreme Greed). When it hits below 20, markets are panicking — historically this has preceded recoveries. When it hits above 80, markets are euphoric — historically this has preceded corrections.
In late February 2026, the index touched 14 — Extreme Fear. The market fell sharply. The total market cap dropped from above $3 trillion in January to $2.41 trillion by March — a 20%+ decline driven almost entirely by sentiment, not by any fundamental change in the technology.
What to do with this: Use the Fear & Greed Index as a context tool, not a buy/sell signal. Extreme fear has historically been a better time to accumulate than extreme greed — but “historically” doesn’t guarantee future results.
6. Regulation — The Rule Change Risk
Regulatory news moves crypto prices more violently than almost any other factor.
When the US SEC approved spot Bitcoin ETFs in January 2024, Bitcoin’s price surged. When China banned crypto trading in 2021, the market dropped 30% in weeks. When Pakistan passed the Virtual Assets Act 2026 in March 2026, local adoption accelerated.
The current regulatory landscape in 2026 is more favorable than any previous period. The US CLARITY Act is moving through Congress, the EU’s MiCA framework is fully active, and multiple countries have either legalized or created formal frameworks for crypto. Grayscale’s 2026 Digital Asset Outlook calls this “the Dawn of the Institutional Era” — regulatory clarity is bringing in capital that previously couldn’t touch crypto due to compliance constraints.
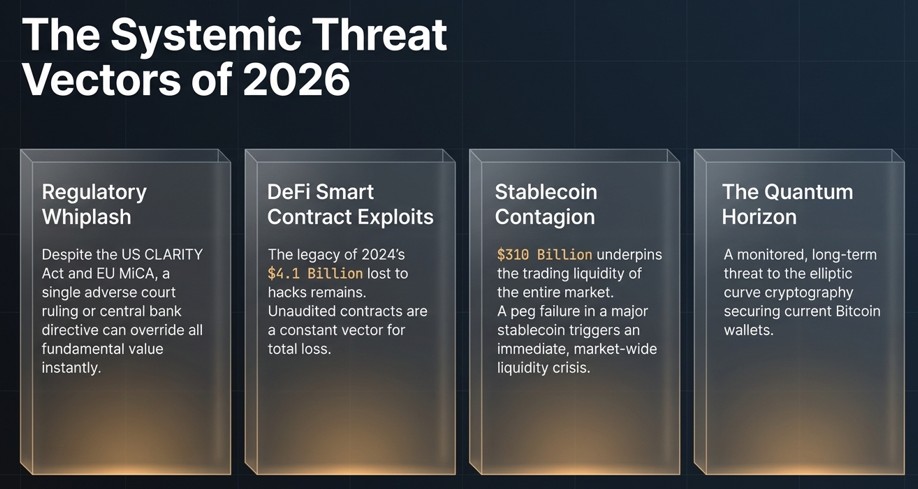
Risk: Regulatory environments can change. A single adverse court ruling, executive order, or central bank directive can trigger sharp sell-offs regardless of a coin’s fundamentals.
The Market Cap Categories: What They Mean in Practice
Quick answer: Large-cap coins (above $10 billion) are more stable but have less explosive upside. Small-cap coins (under $1 billion) can 10x faster but can also go to zero. Here is how to think about each category practically.
Large-Cap (Above $10 Billion) Bitcoin ($1.37T), Ethereum ($523B), XRP ($85B), Solana, BNB. These coins have deep liquidity — you can buy or sell millions of dollars without dramatically moving the price. Institutions hold them. ETFs track them. They fall less during bear markets and recover more reliably. They are not “safe” investments — they are less dangerous than smaller alternatives.
Mid-Cap ($1 Billion to $10 Billion) Coins like Chainlink, Polkadot, Avalanche. These offer potential for faster growth than large caps, but carry higher risk. Less institutional interest. More vulnerable to losing ground in bear markets. Some will graduate to large-cap status; many won’t.
Small-Cap (Under $1 Billion) This is where 10x or 100x returns happen — and where most retail investors lose money. Small-cap coins have thin liquidity. A $50,000 sell order can crash the price by 10%. Team tokens unlocking can wipe 50% of value overnight. Most small-cap coins that existed in 2020 no longer trade in 2026.
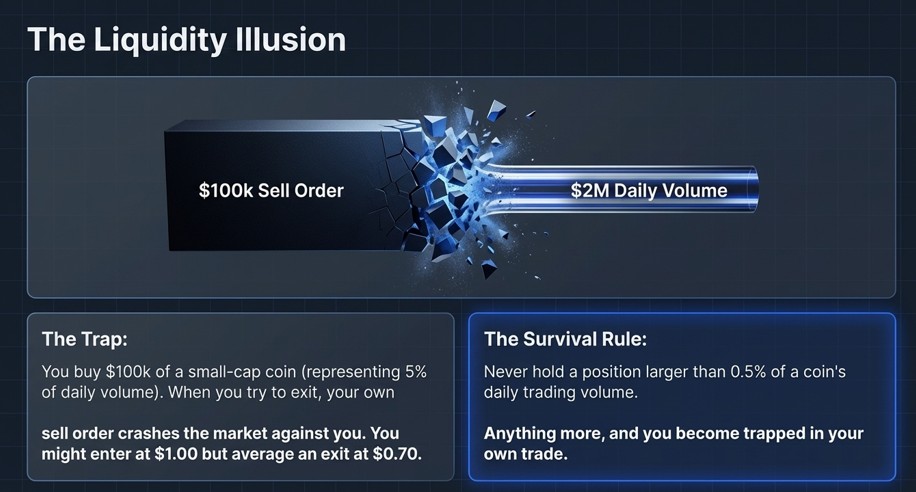
The Liquidity Illusion — What Nobody Explains
A coin can show $2 million in 24-hour trading volume and still be essentially impossible to exit at scale. Here’s why: if you buy $100,000 of a small-cap coin, you might represent 5% of its daily volume. When you try to sell, your own sell order moves the market against you — you push the price down as you exit. You might enter at $1.00 and realize your average exit price is $0.70 simply because your position is too large for the market to absorb.
What to do: For any coin with under $50 million in daily trading volume, keep your position size below 0.5% of that daily volume to avoid the liquidity trap.
What Is Tokenomics and Why Does It Determine Long-Term Value?
Quick answer: Tokenomics is the economic design of a cryptocurrency — how many coins exist, who holds them, when they unlock, and what they’re used for. Bad tokenomics can destroy a coin’s value even if the technology is excellent.
Think of tokenomics as the business model of a crypto project. A good business model sustains value. A bad one bleeds it.
Here are the five tokenomics factors that matter most:
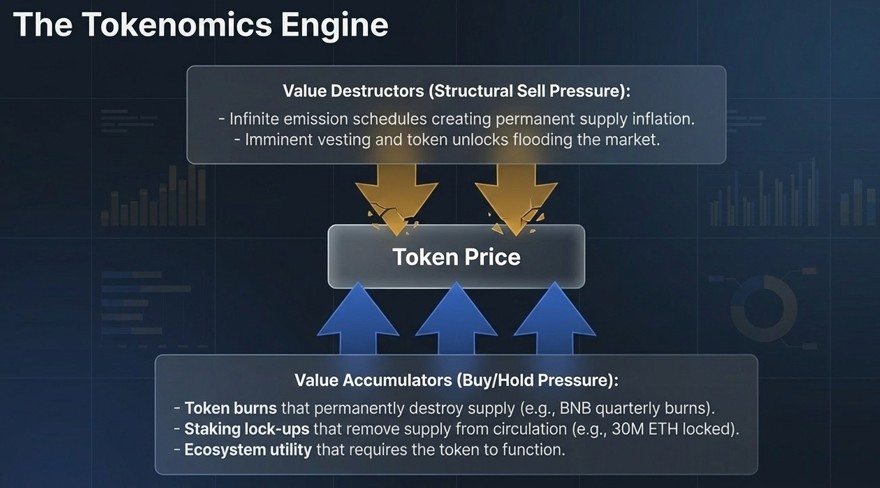
1. Emission Schedule How many new coins are created each year, and when do they stop? Bitcoin’s emission schedule halves every four years until 2140. This means sell pressure from new supply decreases predictably over time. A coin that creates 50 million new tokens per year with no end date has permanent, structural downward pressure on price — regardless of how good the technology is.
2. Vesting and Unlock Schedules When team members, investors, and advisors received tokens at launch, they usually can’t sell immediately — their tokens are locked for 1 to 4 years. When that lock-up period ends and tokens “vest,” large amounts can hit the market simultaneously. Check unlock schedules on tokenomics platforms like Token Unlocks (tokenomist.ai) before investing. A major unlock event coming in the next 3 months is a risk factor.
3. Token Burns Some projects permanently destroy a percentage of tokens with each transaction. BNB (Binance Coin) runs a quarterly burn — Binance removes BNB from circulation until only 100 million remain (from an original 200 million). Ethereum burns ETH with every transaction. Burns reduce supply over time, which supports price if demand holds steady.
4. Staking and Lock-Up Incentives When holders lock their tokens in staking contracts to earn yield, those tokens leave the circulating supply. This reduces sell pressure and creates sustained demand from new users who want to earn staking rewards. Ethereum currently has over 30 million ETH staked — roughly 25% of total supply locked and earning yield, unavailable for immediate sale.
5. Utility Within the Ecosystem Does the token actually need to be used for anything? If using the platform requires spending the token (like ETH for gas fees), demand is structurally tied to usage. If the token can be replaced by any stablecoin and the platform works just as well without it — the token has no fundamental demand driver.
The Stablecoin Dominance Signal — What $310 Billion Parked on the Sidelines Means
Quick answer: When stablecoin market cap rises as a percentage of total crypto market cap, it signals that investors are moving into safety. When stablecoin dominance falls, money is moving back into risk assets. Right now, $310 billion — 12.88% of the market — sits in stablecoins.
This is a practical market-reading tool that almost no beginner-focused article explains.
Stablecoins are cryptocurrencies pegged to the US dollar — USDT (Tether), USDC (Circle), and RLUSD (Ripple) are the major ones. Their price doesn’t change. But their market cap does — it grows when people convert volatile crypto into stablecoins to wait.
When you see stablecoin dominance above 12%, as it is now, it means a significant portion of crypto capital is sitting in cash-equivalent positions. That capital hasn’t left the crypto ecosystem — it’s waiting. If confidence returns and investors rotate from stablecoins back into Bitcoin and Ethereum, it creates buying pressure without needing new money to enter the market.
In the 2020 bull run, stablecoin dominance fell from 15% to 3% as money rotated from USDT into BTC and ETH — Bitcoin went from $10,000 to $60,000 in that period.
What to watch: If stablecoin dominance starts declining while Bitcoin dominance stays flat or grows, it’s a signal that parked capital is rotating back into risk assets. Not a guarantee — a signal worth watching.
Bitcoin Dominance: What 57% Means for the Whole Market
Quick answer: Bitcoin dominance at 57% means Bitcoin controls more than half of all crypto market value. High dominance = altcoins are underperforming. When dominance starts falling, altcoin season typically follows.
Bitcoin dominance is simply Bitcoin’s market cap divided by total crypto market cap. When it rises, it means money is concentrating in Bitcoin — either because investors are cautious (Bitcoin is the “safest” crypto) or because Bitcoin specifically is attracting institutional demand through ETFs.
When Bitcoin dominance falls — say, from 57% toward 45% — it usually means altcoins are growing faster than Bitcoin. Historically, periods of falling Bitcoin dominance have been the best windows for altcoin gains.
Right now at 57%, the market is in a Bitcoin-dominant, risk-off phase. Altcoins are underperforming. This has preceded altcoin bull phases in previous cycles — but not always, and timing it is unreliable.
What not to do: Don’t assume falling Bitcoin dominance automatically means your specific altcoin goes up. In altcoin season, the top 20 coins by market cap gain. The bottom 90% of the market often doesn’t move or moves less. Owning a mid-cap altcoin during “altcoin season” is not guaranteed income.https://thedawncrypto.com/is-crypto-dead-bitcoin-crash-2026/
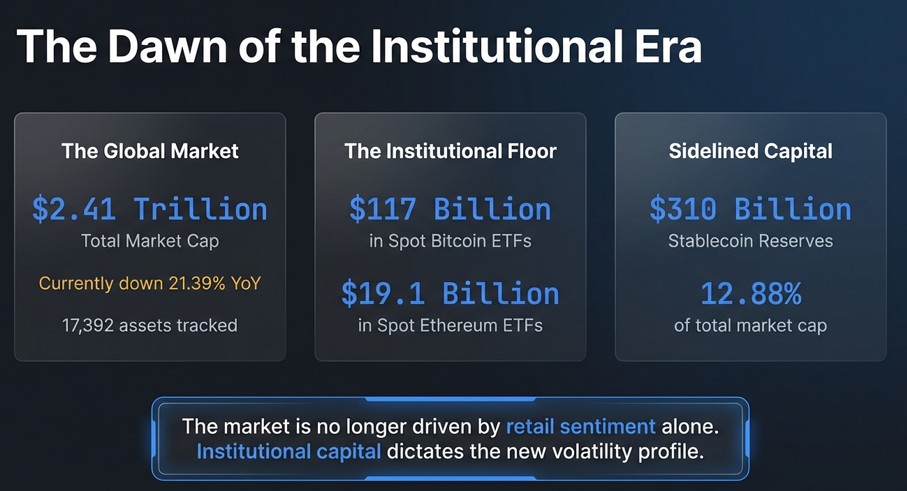
The Institutional Era: How 2026 Changed Crypto Value Permanently
Quick answer: Institutional money entered crypto at scale in 2025–2026 through ETFs, corporate treasuries, and tokenized assets. This changed the volatility profile, the liquidity depth, and the regulatory treatment of crypto permanently.
Fifteen years ago, crypto had $1 million in total market value and one asset. Today it’s a $2.4 trillion market with 17,000 assets, $117 billion locked in Bitcoin ETFs alone, and Grayscale calling 2026 “the Dawn of the Institutional Era.”
What specifically changed:
Spot ETFs from BlackRock (IBIT), Fidelity (FBTC), and others gave institutional investors — pension funds, endowments, wealth managers — a regulated, audited, compliant way to hold Bitcoin. These investors don’t panic-sell at 3am. They rebalance quarterly. This smooths volatility over time.
Corporate treasuries like MicroStrategy (which holds over 400,000 Bitcoin as of 2026), Tesla, and others treat Bitcoin as a balance sheet asset — a hedge against dollar devaluation. This creates structural demand that doesn’t disappear with retail sentiment shifts.
Tokenized real-world assets — US Treasury bills, real estate, and trade finance instruments now live on blockchains as digital tokens. The tokenized asset market reached $5+ billion in 2025 and is growing. This brings traditional finance users into crypto infrastructure without them necessarily buying Bitcoin or Ethereum directly.
What this means practically: The 80%+ drawdowns that Bitcoin experienced in 2014, 2018, and 2022 are less likely to repeat at the same scale. Institutional holders provide a demand floor that retail-only markets didn’t have. This doesn’t mean crypto is safe — it means the extreme downside scenarios are slightly less probable than they were five years agohttps://thedawncrypto.com/government-regulations-bitcoin-market-declines/.
How to Evaluate Any Crypto’s Value Before Buying
Quick answer: Check six things in order — circulating market cap, fully diluted market cap, daily trading volume, token utility, unlock schedule, and on-chain activity. If any of these are red flags, stop there.
Here is the exact checklist to run on any crypto before buying:
Step 1 — Check CoinGecko or CoinMarketCap Look at circulating market cap first. Then look at fully diluted value (FDV). If FDV is more than 5x the circulating market cap, massive token unlocks are coming. Be cautious.
Step 2 — Check 24-Hour Volume vs. Market Cap If a coin has $500 million market cap but only $200,000 in daily trading volume, it’s illiquid. You can’t sell a meaningful position without moving the price against yourself. Volume should ideally be at least 1 to 5% of market cap daily for reasonable liquidity.
Step 3 — Find the Token’s Actual Use Case Go to the project’s official website and whitepaper. Ask: does using this platform require the token? Is there demand that comes from usage — not just speculation? If the token’s only purpose is trading and speculation, it has no fundamental demand floor.
Step 4 — Check Token Distribution Who holds most of the supply? If 5 wallets hold 80% of all tokens, those holders can crash the price by selling. Use blockchain explorers (Etherscan for Ethereum tokens, Solscan for Solana tokens) to see the top wallet holders. Concentrated ownership is a risk.
Step 5 — Check the Unlock Schedule Use tokenomist.ai to see when major token unlocks are scheduled. Team tokens, investor tokens, and ecosystem reserves all have vesting schedules. A large unlock in the next 60 to 90 days is a sell pressure warning.
Step 6 — Check On-Chain Activity Is anyone actually using this blockchain or protocol? For DeFi tokens, check Total Value Locked (TVL) on DeFiLlama. For layer-1 blockchains, check daily active addresses and transaction counts. A token with falling on-chain activity despite rising price is often a warning sign of speculative inflation without fundamental backing.
Real Risks That Could Affect Crypto Value in 2026
No article on crypto value is complete without honest risk disclosure. Here are the specific ones active right now.
Macro Correlation Risk Crypto now moves more closely with the Nasdaq 100 than it did in previous cycles — the correlation coefficient is around 0.80. When tech stocks fall on Federal Reserve rate concerns or economic data, crypto falls too. The AI stock bubble, if it deflates sharply, could take crypto down with it regardless of on-chain fundamentals.
The $4.1 Billion DeFi Hack Legacy In 2024, $4.1 billion was lost to DeFi exploits — smart contract bugs, bridge hacks, and rug pulls. In 2025, the number improved but remained in the billions. Every time a major protocol gets exploited, it triggers broad sell-offs across related assets as confidence drops. Never keep funds in unaudited DeFi protocols.
Stablecoin Systemic Risk $310 billion in stablecoins sits at the foundation of the crypto market. If any major stablecoin — particularly USDT — faces a bank run or loses its peg, the effect on the entire market would be immediate and severe. USDT has maintained its peg through multiple crises, but it’s not infallible. Never treat stablecoins as equivalent to cash in a bank account.
Quantum Computing Threat (Long-Term) Current Bitcoin wallets use elliptic curve cryptography that today’s computers cannot break. Quantum computers, if they reach sufficient power, could theoretically break this encryption. The crypto industry is actively developing post-quantum cryptographic solutions. Grayscale notes this as a 2026 concern to monitor but not a near-term threat. It’s worth knowing it exists.
The Illusion of Diversification Owning 10 different cryptocurrencies does not meaningfully diversify risk. In bear markets, correlation between all crypto assets approaches 1 — they fall together. True diversification requires assets that move independently, like stocks, bonds, real estate, or cash, alongside any crypto holdings.https://thedawncrypto.com/future-of-crypto-opportunities-and-risks/
What This All Means If You’re Just Starting Out
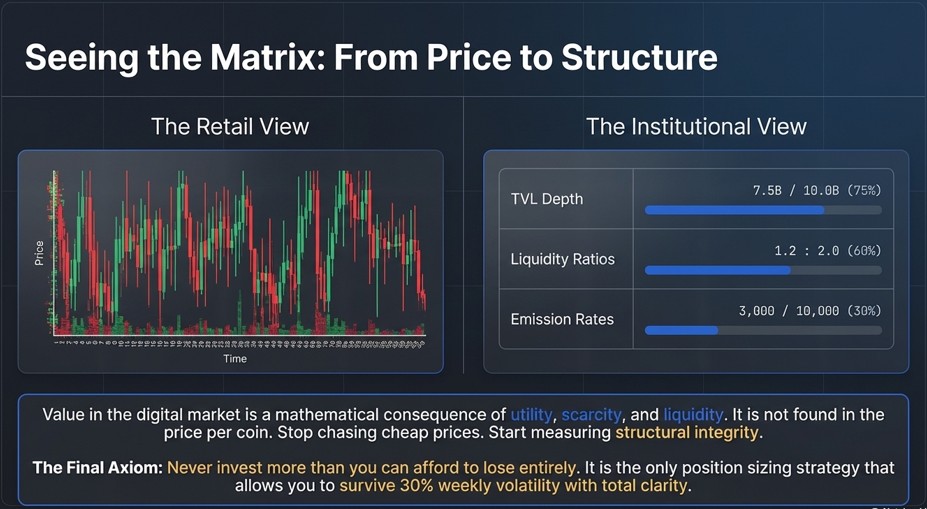
Understanding crypto value in the digital market comes down to one shift in thinking: stop looking at price per coin and start looking at market capitalization, utility, liquidity, and tokenomics together.
The global crypto market at $2.41 trillion is real, institutional, and growing — but it’s also volatile, complex, and full of assets that will lose 90%+ of their value. Bitcoin and Ethereum have proven their value models over 15+ years of cycles. Most of the remaining 17,000+ coins have not.
Start with understanding before buying. Check the market cap. Check the FDV. Verify the utility. Look at the unlock schedule. Understand what you’re buying and why before committing any capital.
And never invest more than you can afford to lose entirely — not because this is a legal disclaimer, but because it’s the only position size that lets you think clearly when the market drops 30% in a week.
This article is for educational purposes only. It does not constitute financial or investment advice. Cryptocurrency values are highly volatile and past performance does not guarantee future results. Always conduct independent research before making any financial decision.
![How to Build a Crypto Risk Management Checklist for Beginners [2025]](https://thedawncrypto.com/wp-content/uploads/2026/03/Crypto-Risk-Management-Checklist-for-Beginners-660x470.webp)