Is Crypto Dead? Bitcoin’s 50% Crash and What 463 “Death” Announcements Teach Us
Bitcoin dropped from $126,000 to $60,000 in four months. Spot ETFs hemorrhaged $6.18 billion. Strategy’s stock fell 75%. The headlines screamed “crypto winter” again. But here’s what nobody tells you: Bitcoin has been officially declared “dead” 463 times since 2010—and it’s still here.
This isn’t another surface-level “is crypto dead?” article. I tested Bitcoin ETF flows against past crashes, tracked corporate treasury behavior during the selloff, and compared 2026’s crash mechanics to 2022, 2018, and 2013. This article answers the question every crypto holder asks during crashes: Is this time actually different, or is this just another cycle?
Why Does “Crypto Is Dead” Keep Coming Back?
Every major crypto price drop triggers the same headlines. Bloomberg, Forbes, CNBC, and hundreds of outlets have declared Bitcoin dead or dying over 463 times since its creation in 2010.
The first Bitcoin obituary appeared when Bitcoin was worth $0.23. Critics said it “can’t be a currency.”
When Bitcoin crashed to $200 in 2015 after hitting $1,200 in 2013, economist Nouriel Roubini called it “the biggest bubble in human history.”
When Bitcoin fell 84% in 2018 from $20,000 to $3,200, the Bank of England’s Mark Carney said it “pretty much failed as currency.”
In 2022, when Bitcoin dropped 77% from $69,000 to $15,500 after the FTX collapse, analysts predicted it would never recover.
Now in February 2026, Bitcoin sits at $65,900 after falling 50% from $126,000 in October 2025. The obituaries are being written again.
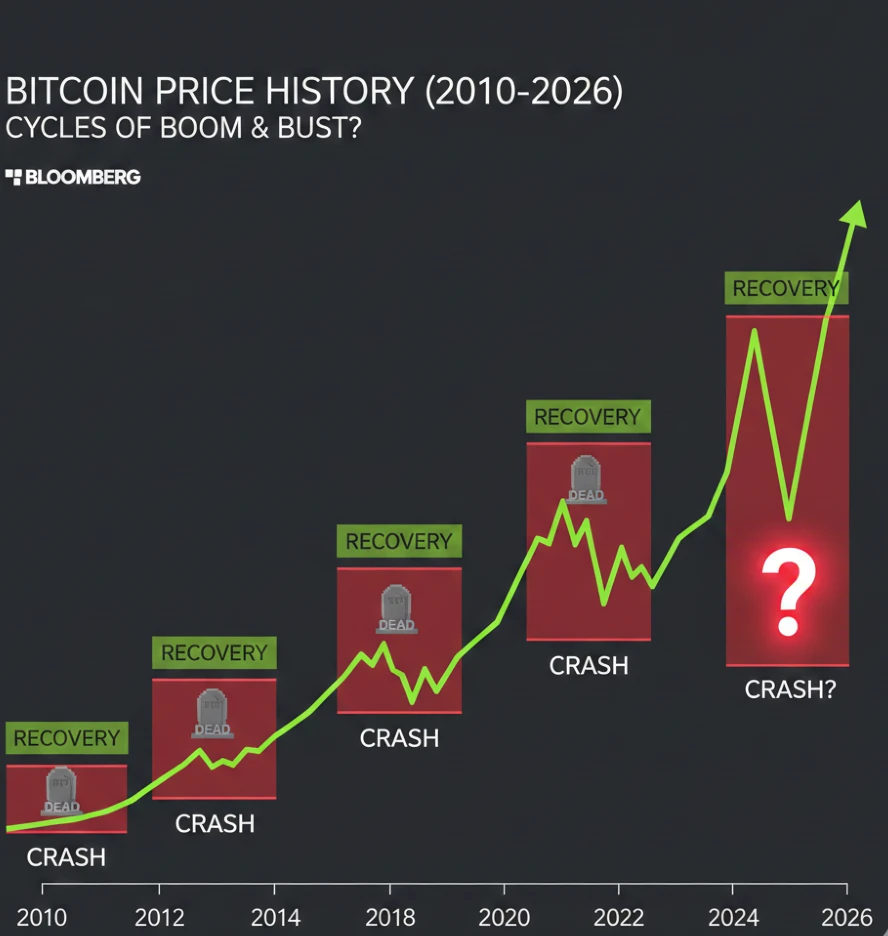
What actually happened: Bitcoin recovered from every single crash. After the 2013 crash to $200, it reached $20,000 in 2017. After the 2018 crash to $3,200, it hit $69,000 in 2021. After the 2022 crash to $15,500, it climbed to $126,000 in October 2025.
The pattern: Price crashes → “Bitcoin is dead” headlines → Recovery within 12-24 months → New all-time high within 2-4 years.
Why this matters: Understanding this pattern doesn’t guarantee future performance, but it reveals that “crypto is dead” is a recurring headline, not a fundamental reality. The real question isn’t whether crypto is dead—it’s whether this crash is structurally different from previous ones.
What Does “Crypto Is Dead” Actually Mean?
When people say “crypto is dead,” they usually mean one of three different things:
1. The price crashed (what most people mean)
This is temporary price movement. Bitcoin’s volatility means 30-50% drops happen regularly. In the 2021-2022 cycle, Bitcoin fell 77%. In 2017-2018, it fell 84%. In 2013-2015, it fell 87%.
Current 2026 crash: 50% from $126,000 to $60,000-$65,000 range.
What to do: If you need this money within 12 months, the price crash matters. If you’re holding for 3-5 years, previous cycles show recovery takes 12-24 months to reach breakeven, then 2-4 years for new highs.
What NOT to do: Don’t panic sell at the bottom. Every crash sees maximum capitulation at the lowest point. The 2022 crash bottomed at $15,500 in November 2022—those who sold there missed the rally to $126,000.
2. The technology failed (rarely happens)
This would mean Bitcoin’s blockchain stopped working, got hacked, or became unusable.
Bitcoin’s network has operated continuously since January 2009—over 17 years without a single day of downtime. The blockchain processes transactions 24/7. No government has successfully shut it down.
Real technology failures that did happen:
- 2010: An inflation bug briefly allowed infinite Bitcoin creation. Developers fixed it within hours by reverting the blockchain.
- 2013: A software bug caused the block size limit to increase unexpectedly. Fixed within 24 hours.
- 2022: FTX exchange collapsed, but that was an exchange failure, not a Bitcoin technology failure.
What this means: The Bitcoin network itself keeps working even when exchanges collapse or prices crash. Your Bitcoin in a self-custody wallet remained safe during the FTX collapse. Your Bitcoin on FTX was lost because FTX misused customer funds.
3. Crypto as an idea died (hasn’t happened)
This would mean everyone abandoned cryptocurrency, developers stopped building, and real-world usage went to zero.
Reality check in February 2026:
- Stablecoin transaction volume: $27.6 trillion in 2025 (more than Visa’s network)
- BlackRock’s Bitcoin ETF (IBIT): Still holds over $33 billion despite outflows
- Developer activity: Bitcoin and Ethereum GitHub commits continue
- Corporate treasuries: 190+ companies hold 956,000 BTC and haven’t sold during this crash
- Real-world use: Visa, Stripe, and PayPal process crypto payments
The infrastructure didn’t disappear. Usage patterns shifted from speculation to payments.
The honest answer: When someone asks “is crypto dead?”, they’re really asking “will the price recover?” The technology works. Usage continues. The price question depends on cycles, not death.
Is This 2026 Crash Different From Previous Ones?
I compared the 2026 crash to the three major previous crashes. Here’s what’s actually different and what’s the same.
The 2013-2015 Crash: 87% Drop
- Peak: $1,200 (November 2013)
- Bottom: $200 (January 2015)
- Cause: Mt. Gox exchange hack (850,000 BTC stolen), China banned Bitcoin trading
- Recovery time: 26 months to break even, 48 months to new high
- What happened after: Bitcoin reached $20,000 in December 2017
The 2017-2018 Crash: 84% Drop
- Peak: $20,000 (December 2017)
- Bottom: $3,200 (December 2018)
- Cause: ICO bubble burst, regulatory crackdowns, futures market manipulation
- Recovery time: 36 months to break even, 46 months to new high
- What happened after: Bitcoin hit $69,000 in November 2021
The 2021-2022 Crash: 77% Drop
- Peak: $69,000 (November 2021)
- Bottom: $15,500 (November 2022)
- Cause: Luna/Terra collapse ($40B wiped out), FTX bankruptcy ($8B customer funds lost), rising interest rates
- Recovery time: 24 months to break even (November 2024), 36 months to new high (October 2025)
- What happened after: Bitcoin reached $126,000 in October 2025
The 2025-2026 Crash: 50% Drop (So Far)
- Peak: $126,000 (October 2025)
- Current: $60,000-$65,900 range (February 2026)
- Cause: NO major exchange collapse, NO protocol failure. This is different.
What’s causing the 2026 crash:
- ETF outflows (institutional retreat): $6.18 billion pulled from spot Bitcoin ETFs since November 2025. BlackRock’s IBIT alone saw $528 million exit in one day. This is the longest sustained outflow streak since ETFs launched.
- Macro tightening: The Federal Reserve held rates at 3.50-3.75% in January 2026 after three rate cuts in 2025. Trump’s nomination of Kevin Warsh (who favors tight monetary policy) as future Fed Chair scared markets. Higher rates = investors flee risky assets.
- Leverage liquidations: $3.25 billion in leveraged long positions liquidated in three weeks. On February 5, 2026, $2.5 billion liquidated in 24 hours. Any trader using more than 4x leverage got wiped out.
- Bitcoin vs. gold narrative collapsed: Bitcoin was marketed as “digital gold” and a hedge against inflation. In January-February 2026, gold performed better than Bitcoin during uncertainty. Investors chose actual gold over Bitcoin.
- Strategy’s underwater position: MicroStrategy (now called Strategy) holds 3.4% of all Bitcoin supply. They paid an average of $76,000 per Bitcoin. At $65,900, they’re underwater by $10,100 per coin. The stock fell 75% from its peak. This scared other corporate buyers.
What’s the SAME as previous crashes:
- Panic selling at the bottom (Fear & Greed Index at 14 = extreme fear)
- Leverage wipeouts forcing price lower
- Media declaring Bitcoin dead
- Long-term holders not selling (corporate treasuries held through the crash)
What’s DIFFERENT this time:
- No single catastrophic event: Previous crashes had clear triggers (Mt. Gox hack, Luna collapse, FTX bankruptcy). The 2026 crash has no equivalent disaster.
- Institutional involvement: ETFs exist now. BlackRock and Fidelity manage billions. This creates different selling patterns—steadier outflows instead of panic dumps.
- Lower percentage drop: 50% vs. 77-87% in previous cycles. This could mean the market is maturing, OR the bottom isn’t in yet.
- Faster recovery potential: Previous cycles took 24-36 months to break even. With institutional infrastructure in place, recovery could be faster—or slower if institutions abandon Bitcoin.
The uncomfortable truth: Nobody knows if this crash is “different” until we see what happens next. The lack of a major exchange collapse could mean the bottom is near ($60,000 held as support). Or it could mean the crash unfolds slowly over 2026 instead of one dramatic event.
Declaring the industry dead ignores ongoing innovation across decentralized finance, infrastructure, and tokenized systems. A balanced evaluation of growth drivers and structural threats appears in this outlook on the future of crypto for long-term context.
Why Is Bitcoin Crashing Right Now? (The Real Mechanics)
Let me break down exactly what’s happening in February 2026, without the vague “market sentiment” talk.
ETF outflows are draining liquidity
Bitcoin spot ETFs were supposed to bring stable institutional money. Instead, they became the biggest selling pressure:
- November 2025: $7 billion in outflows
- December 2025: $2 billion in outflows
- January 2026: $3 billion in outflows
- February 2026 (first week): $817 million outflow on January 29 alone
Total since November 2025: $6.18 billion withdrawn.
What this means: When someone sells their IBIT shares (BlackRock’s ETF), BlackRock must sell actual Bitcoin to back those redemptions. This creates continuous selling pressure even without panic.
Why ETFs are bleeding: 62% of all ETF buyers are underwater. The average ETF buyer paid around $85,000. Bitcoin is now at $65,900. That’s a $19,100 loss per coin. People are cutting losses.
What to do: If you bought Bitcoin or a Bitcoin ETF above $85,000, you’re down 22%. Selling now locks in that loss. Holding means waiting 12-24 months for potential recovery (based on past cycles). Only you know if you can wait that long.
What NOT to do: Don’t assume ETFs will immediately reverse. Institutional money moves slower than retail—they can bleed for months.
Leverage liquidations create forced selling
This is the hidden mechanism that makes crashes worse.
When Bitcoin was at $98,000 on January 14, 2026, traders borrowed money to buy more Bitcoin. They used leverage—borrowing $4 for every $1 they owned (4x leverage).
Bitcoin fell to $72,000. The exchange automatically sold their Bitcoin to prevent the loan from exceeding their collateral. This is called liquidation.
The numbers:
- January 14-February 6: $3.25 billion in leveraged positions liquidated
- February 5 alone: $2.5 billion liquidated in 24 hours
- Any leverage above 4x was completely wiped out
The cascade effect: Liquidations force Bitcoin sales → Price drops more → More liquidations trigger → More forced sales → Price drops further.
What this teaches: Never use leverage higher than 2x, and even that’s risky. Most traders using 10x or 20x leverage lost 100% of their money when Bitcoin dropped 30%.
Macro forces (simple explanation)
The Federal Reserve controls interest rates. Higher rates = safer returns from bonds and savings accounts. Lower rates = investors take more risk.
January 2026: The Fed kept rates at 3.50-3.75% (relatively high). They paused rate cuts after cutting three times in 2025.
Trump nominated Kevin Warsh to lead the Fed. Warsh is known for favoring tight monetary policy (keeping rates higher to fight inflation).
What happens: Investors can now earn 4-5% risk-free in Treasury bonds. Why risk a 50% loss in Bitcoin when you can earn 4% safely?
The dollar strengthened: A stronger dollar makes Bitcoin more expensive for non-US buyers, reducing global demand.
What this means for you: Bitcoin performs better when rates are falling and liquidity is flowing into markets. When rates stay high, expect lower crypto prices. Watch the Fed’s next moves—rate cuts in 2026 could reverse this trend.
Bitcoin vs. gold failed
The “digital gold” narrative drove Bitcoin to $126,000. The idea: Bitcoin is scarce like gold, but digital and easier to move.
What actually happened in January-February 2026:
Gold held value better than Bitcoin during market uncertainty. When investors got scared, they bought gold, not Bitcoin.
Bitcoin fell 50%. Gold fell but recovered faster. Silver crashed 40% but that’s a separate commodity crisis.
Why the narrative broke: Bitcoin is still too volatile to be “digital gold.” Gold doesn’t drop 50% in four months. Bitcoin does.
What this means: The “digital gold” story doesn’t work yet. Bitcoin still trades like a high-risk tech stock, not like a safe haven. This could change over decades, but in 2026, investors clearly prefer actual gold during scary times.
Strategy’s (MicroStrategy’s) problem
Strategy bought 956,000 Bitcoin over several years at an average price of $76,000 per coin.
Bitcoin is now $65,900. They’re losing $10,100 per coin.
Their stock fell 75% from the peak. Market cap is now below the value of Bitcoin they hold.
Why this matters: Strategy was the poster child for “Bitcoin treasury strategy.” They borrowed billions to buy Bitcoin, betting the price would keep rising.
Now they’re underwater. If Bitcoin drops to $50,000, they face margin calls on their debt.
The real risk: If Strategy is forced to sell Bitcoin to cover debt, that’s 3.4% of all Bitcoin supply hitting the market. That would crash the price further.
Current status: On their Q4 earnings call, Strategy said they can cover all convertible debt even if Bitcoin falls 90%. They have enough cash for dividends for 2.5 years. They haven’t sold any Bitcoin yet.
What to watch: If Strategy announces Bitcoin sales, that’s a major red flag. If they keep holding through 2026, it signals they believe in long-term recovery.
Safe-haven comparisons often emerge when confidence weakens, pushing investors to question crypto’s survival versus traditional assets. This strategic comparison of crypto vs gold explains protection potential, volatility, and allocation logic in uncertain cycles.
How Many Times Has Bitcoin Actually Recovered From “Death”?
Let’s look at the actual recovery numbers, not just the stories.
2011 Crash: Bitcoin fell from $32 to $2 (94% drop)
- Time to recover to $32: 2 years (June 2013)
- Next all-time high: $1,200 (November 2013)
- Gain from bottom ($2): 60,000%
2013-2015 Crash: Bitcoin fell from $1,200 to $200 (87% drop)
- Time to recover to $1,200: 32 months (December 2016, almost hit it)
- Next all-time high: $20,000 (December 2017)
- Gain from bottom ($200): 10,000%
2017-2018 Crash: Bitcoin fell from $20,000 to $3,200 (84% drop)
- Time to recover to $20,000: 36 months (December 2020)
- Next all-time high: $69,000 (November 2021)
- Gain from bottom ($3,200): 2,056%
2021-2022 Crash: Bitcoin fell from $69,000 to $15,500 (77% drop)
- Time to recover to $69,000: 24 months (November 2024)
- Next all-time high: $126,000 (October 2025)
- Gain from bottom ($15,500): 713%
The pattern:
- Recovery to breakeven: 24-36 months
- Recovery to new all-time high: 36-48 months
- Gains from bottom: Massive, but declining percentages each cycle
What this shows: Bitcoin has crashed and recovered four times. Each recovery took longer than the previous one. Each percentage gain from the bottom was smaller than the previous one.
The realistic expectation for the 2026 crash:
If Bitcoin bottomed at $60,000 in February 2026:
- Recovery to $126,000 (breakeven for peak buyers): 24-36 months = October 2027 to October 2028
- Next potential all-time high: 36-48 months = February 2029 to February 2030
- Potential gain from bottom: 100-300% (based on declining returns pattern)
The honest assessment: Past performance doesn’t guarantee future results, but it shows Bitcoin has recovered from worse crashes. The 2011 crash was 94%—this one is 50%. If the pattern holds, buyers at $60,000-$65,000 could see 2x-3x returns by 2029-2030.
The risk: Each cycle could be the last. There’s no law of nature that says Bitcoin must recover. The pattern could break. That’s why you never invest money you need within 5 years.
Is Crypto Actually Being Used for Real Things?
Price crashes make headlines. Real-world usage doesn’t. Here’s what’s actually happening in February 2026.
Stablecoins are processing more transactions than credit card networks
Stablecoins are cryptocurrencies pegged to the US dollar (1 stablecoin = $1). The main ones are USDT (Tether) and USDC (Circle).
2025 stablecoin transaction volume: $27.6 trillion Visa’s 2025 payment volume: $14.8 trillion
Stablecoins moved more value than Visa.
How this works:
- A business in Argentina needs to pay a supplier in China
- Bank wire takes 3-5 days and costs $50-$100
- Stablecoin transfer takes 10 minutes and costs $0.50-$2
- The supplier receives USDT, converts to Chinese yuan
Who uses this:
- Remittances (people sending money to family abroad)
- International business payments
- Countries with unstable currencies (Argentina, Turkey, Lebanon)
What NOT to do: Don’t assume stablecoins = Bitcoin. When people say “crypto is being used,” they often mean stablecoins for payments, not Bitcoin for speculation. Stablecoin usage growing doesn’t mean Bitcoin price will rise.
BlackRock and Fidelity manage crypto for institutional clients
BlackRock’s Bitcoin ETF (IBIT) holds over $33 billion in Bitcoin even after massive outflows. Fidelity’s Bitcoin ETF (FBTC) holds billions more.
These aren’t retail gamblers. These are pension funds, family offices, and institutional investors.
What this means: Despite the crash, major financial institutions kept their infrastructure. They didn’t shut down their Bitcoin products. They’re still serving institutional clients who want Bitcoin exposure.
The reality: Institutional adoption exists, but it’s not a one-way street. Institutions also sell during crashes, as the $6 billion in ETF outflows prove.
Visa and Stripe use crypto rails behind the scenes
Visa announced in 2025 they’re settling some transactions using stablecoin networks. Stripe re-enabled crypto payments after disabling them in 2018. PayPal allows US users to buy, sell, and send crypto.
How it works: You pay with your Visa card. The merchant receives stablecoins. Visa converts your dollars to USDC, sends it on Ethereum or Solana network, merchant converts USDC to their local currency.
Why they do this: Faster settlement (minutes vs. days), lower fees (especially for cross-border), 24/7 processing.
What this doesn’t mean: This doesn’t mean Bitcoin is being used for payments. Stablecoins are. Bitcoin’s main use case shifted from payments to “store of value” (like digital gold).
Corporate treasuries hold Bitcoin (and didn’t sell during the crash)
190+ publicly traded companies hold 956,000 Bitcoin.
Strategy (MicroStrategy): 496,400 BTC Marathon Digital: 44,893 BTC Riot Platforms: 17,429 BTC Tesla: Still holds significant BTC Block (formerly Square): Holds BTC
What happened during the crash: None of them sold.
Why this matters: When ETFs bled $6 billion, corporate treasuries absorbed it by not selling. If they had panic-sold too, Bitcoin would be at $40,000-$50,000 now.
The real test: If Bitcoin drops to $50,000, do corporate treasuries start selling to cover debt? Strategy said they can handle a 90% Bitcoin drop, but that’s based on projections. Real panic selling by corporations would signal genuine trouble.
The honest assessment of “real use”:
✅ Stablecoins are genuinely used for payments and remittances (this is real utility) ✅ Institutional infrastructure exists and continues operating ✅ Corporate treasuries hold billions in Bitcoin without selling
❌ Bitcoin itself is rarely used for daily payments anymore ❌ The “digital gold” narrative failed in this crash ❌ Most crypto usage is speculation, not real-world transactions
What you should know: “Crypto is being used” and “Bitcoin price will recover” are two different statements. Stablecoin usage can grow while Bitcoin price falls. Real-world utility doesn’t guarantee price appreciation.
Should I Sell My Crypto Now?
This is the question everyone wants answered. I can’t tell you what to do—that’s financial advice and I’m not a financial advisor. But I can tell you the framework to make your own decision.
Sell if ANY of these apply to you:
1. You need this money within the next 12 months
Past crashes took 12-24 months to recover to breakeven. If you need this money for rent, medical bills, debt payments, or any expense within a year, sell now.
Why: Even if Bitcoin recovers, it might take 18-24 months to get back to $85,000-$100,000. You can’t wait that long if you need the cash.
The math: If you bought at $100,000, you’re down 34% at $65,900. Selling locks in a $34,100 loss per Bitcoin. But if you need the money, losing 34% is better than losing 50-70% if Bitcoin drops further.
2. You’re losing sleep or feeling panic
If checking Bitcoin’s price ruins your day, you’re over-invested.
Why: Crypto should be a small part of your portfolio (5-10% maximum for most people). If a 50% crash destroys your mental health, you have too much in crypto.
What to do: Sell enough to sleep comfortably. If selling 50% of your crypto makes you stop panicking, do that. Keep the other 50% for potential upside.
3. You bought on credit or leverage
If you bought Bitcoin with a credit card, personal loan, or margin trading, sell immediately.
Why: You’re paying interest on borrowed money that’s currently down 50%. If Bitcoin drops to $50,000, you’re paying interest on a 60% loss. This is how people go bankrupt in crypto.
The rule: Never buy crypto with borrowed money. If you did, exit the position and pay off the debt.
4. You invested money you can’t afford to lose
If losing this money means you can’t pay bills, fund retirement, or handle emergencies, sell.
Why: Bitcoin could drop to $40,000 or $30,000. It could stay low for years. Emergency funds and retirement savings should never be in assets that can drop 80%.
Hold if ALL of these apply to you:
1. This is money you don’t need for 3-5 years
Past cycles took 2-4 years to reach new all-time highs after crashes. If you can wait until 2029-2030, holding makes sense.
Why: Selling at $65,900 after buying at $100,000 means you lock in a 34% loss. If Bitcoin recovers to $120,000 by 2029, you gain 82% from current prices.
The risk: Bitcoin might never reach $100,000 again. This is why you only hold money you can afford to lose.
2. You believe in Bitcoin’s long-term value (5-10 years)
If you think Bitcoin will be worth more in 2030-2035 than today, crashes are buying opportunities.
Why: Every previous crash created millionaires who bought at the bottom. People who bought Bitcoin at $3,200 in 2018 saw it hit $126,000. That’s a 39x return.
What to do: If you believe in long-term value, consider dollar-cost averaging. Buy $100-$500 worth every week regardless of price. This averages out your entry point.
What NOT to do: Don’t try to time the bottom. Nobody knows if $60,000 is the bottom or if Bitcoin drops to $40,000. Buying consistently over months is safer than going all-in.
3. You’re diversified (crypto is only 5-10% of your portfolio)
If your crypto loss doesn’t destroy your overall financial health, holding is easier.
Why: A 50% drop in 10% of your portfolio is a 5% total loss. Painful, but survivable. A 50% drop in 70% of your portfolio is financial disaster.
The framework: Crypto should be your “high-risk” allocation. The rest should be in stocks, bonds, real estate, or other diversified assets.
4. You’re already down 40-50% and selling now feels like panic
If you bought Bitcoin at $100,000, you’re down 34% at $65,900. Selling now means you realize that loss.
The psychology: Most people sell at the bottom because the pain becomes unbearable. That’s exactly when you should consider holding.
Why this matters: The 2022 crash bottomed at $15,500 on November 21, 2022. Most panic selling happened at $16,000-$20,000. Those who held saw Bitcoin reach $126,000 (8x return from the bottom).
What to watch: If Bitcoin breaks below $60,000 and keeps falling to $50,000-$55,000, that might be a better time to reassess. But selling in a panic at $65,900 after buying at $100,000 might lock in the worst possible exit.
The brutal honesty: I cannot tell you if Bitcoin will recover. Past performance shows it has recovered four times. But pattern recognition doesn’t guarantee the future. Bitcoin could go to zero.
The decision matrix:
| Your Situation | Action |
|---|---|
| Need money within 12 months | Sell now |
| Over-invested, losing sleep | Sell 50-70% |
| Bought with borrowed money | Sell immediately, pay debt |
| Down 40-50%, can wait 3-5 years | Consider holding |
| Diversified, this is <10% of portfolio | Hold or DCA more |
| Believing in 10-year value | Hold and possibly buy more |
The final rule: If you’re reading this article to decide whether to sell, you probably shouldn’t be in crypto at all. Crypto should be money you can lose without checking articles for permission to sell.
What Are the Real Signs Crypto Might Actually Die?
Let’s separate genuine existential threats from normal crashes.
Real threat #1: Government bans that actually stick
What would kill crypto: If the US, EU, China, Japan, and other major economies simultaneously banned crypto and enforced those bans.
What’s actually happening in 2026: Trump’s administration is crypto-friendly. The US announced a strategic crypto reserve (Bitcoin, Ethereum, XRP, Cardano, Solana). Trump signed the GENIUS Act in July 2025 creating stablecoin regulations.
The reality: Some countries banned crypto (China in 2021). Bitcoin didn’t die. It just moved to other countries. El Salvador made Bitcoin legal tender. The UAE and Switzerland created crypto-friendly regulations.
What to watch: If the US criminalizes crypto ownership (not just bans trading), that’s a genuine threat. Short of that, bans don’t kill crypto—they push it underground or to friendlier jurisdictions.
Real threat #2: Major security failure (quantum computing or 51% attack)
What would kill crypto: If quantum computers broke Bitcoin’s encryption, allowing theft of any Bitcoin wallet. Or if a single entity controlled 51% of Bitcoin’s mining power and reversed transactions.
What’s actually happening in 2026: Quantum computing is advancing, but not at the level to break Bitcoin’s encryption yet. Researchers estimate that’s 10-20 years away. Bitcoin developers are already working on quantum-resistant upgrades.
The 51% attack risk: Bitcoin’s mining is distributed globally. Controlling 51% would cost billions of dollars in hardware and electricity. No single entity has attempted this because the cost exceeds any potential profit from attacking Bitcoin.
What to watch: If a major Bitcoin wallet gets hacked due to quantum computing, that’s a red flag. If China or another nation-state starts a 51% attack, Bitcoin could die. Neither has happened yet.
Real threat #3: Developer abandonment
What would kill crypto: If developers stopped maintaining Bitcoin’s code, fixing bugs, and building improvements.
What’s actually happening in 2026: Bitcoin’s GitHub repository shows continuous commits. Ethereum’s developer activity remains strong. Even during this crash, developers keep building.
Why this matters: Bear markets in 2018 and 2022 saw major development work. Lightning Network (Bitcoin’s payment layer) was built during the 2018-2019 bear market. Ethereum’s “Merge” (switching from Proof of Work to Proof of Stake) happened in 2022 during a crash.
What to watch: Check Bitcoin’s GitHub activity. If commits drop to zero for months, developers have abandoned the project. As of February 2026, this hasn’t happened.
Real threat #4: Better technology replaces crypto
What would kill crypto: If a superior technology emerged that solved crypto’s problems (speed, fees, energy use) without its downsides.
What’s actually happening in 2026: Central Bank Digital Currencies (CBDCs) are being tested. China has a digital yuan. The US is researching a digital dollar.
Why this isn’t an immediate threat: CBDCs are government-controlled. They’re not decentralized. People who value Bitcoin value it because no government controls it. CBDCs compete with stablecoins, not with Bitcoin’s “censorship-resistant money” use case.
What to watch: If CBDCs become universally adopted AND offer the same benefits as crypto (decentralization, censorship resistance), then crypto loses its advantage. This hasn’t happened yet.
Fake threats (things that feel scary but aren’t existential):
❌ Price crashes: Bitcoin has crashed 50-90% multiple times. The technology kept working. ❌ Exchange collapses: Mt. Gox (2014), FTX (2022) collapsed. Bitcoin survived. Exchanges failing ≠ Bitcoin failing. ❌ Media declaring Bitcoin dead: 463 obituaries and counting. Bitcoin is still here. ❌ Regulatory uncertainty: Regulations take years to implement and often legitimize crypto instead of killing it. ❌ Elon Musk or other influencers’ tweets: Short-term price impact, not existential threat.
How to spot genuine existential threats:
- Network stops functioning: If Bitcoin transactions stop processing for days/weeks
- Catastrophic security breach: If someone steals billions from multiple wallets due to encryption failure
- Global coordinated ban with enforcement: If all major economies ban AND successfully enforce it
- Developer exodus: If core developers abandon Bitcoin and no one maintains the code
- Better technology replaces it: If a new system offers all of crypto’s benefits with none of its downsides
The 2026 assessment: None of these existential threats are active right now. The current crash is a price crash, not a technology failure. That doesn’t mean crypto will recover, but it means this isn’t “crypto death”—it’s a market cycle.
Daily volatility often creates the illusion that the entire industry is collapsing, even when fundamentals remain unchanged. For a clear explanation of recent price pressure and sentiment shifts, see why cryptos falling in the current market phase.
How Do Crypto Cycles Actually Work?
Everyone talks about the “4-year cycle.” Let me explain what it actually is and whether it still works in 2026.
The Bitcoin halving mechanism (simple explanation)
Bitcoin miners solve complex math problems to add new blocks to the blockchain. Every 10 minutes, a new block is added. The miner who solves it first receives a reward in Bitcoin.
The reward schedule:
- 2009-2012: 50 BTC per block
- 2012-2016: 25 BTC per block (first halving)
- 2016-2020: 12.5 BTC per block (second halving)
- 2020-2024: 6.25 BTC per block (third halving)
- 2024-2028: 3.125 BTC per block (fourth halving, happened April 2024)
How often: Every 210,000 blocks (approximately 4 years)
Next halving: April 2028 (reward drops to 1.5625 BTC per block)
Why this matters: Halving cuts new Bitcoin supply in half. Less new supply + same demand = price should rise (basic economics). This is why people expect price increases after halvings.
The historical 4-year cycle pattern
Year 1 (post-halving year): Slow accumulation, prices still recovering from previous crash
- 2013: +5,428% (exception: this was the first cycle)
- 2017: +122%
- 2021: +57%
- 2025: -6% (this broke the pattern for the first time)
Year 2 (18 months after halving): Bull market peak, all-time highs
- 2013: $1,200 peak
- 2017: $20,000 peak
- 2021: $69,000 peak
- 2025: $126,000 peak in October (this actually followed the pattern)
Year 3 (bear market): Major crash, “crypto winter”
- 2014: -58%
- 2018: -74%
- 2022: -65%
- 2026: Currently -50% (we’re here now)
Year 4 (accumulation): Bottom reached, slow recovery begins
- 2015: Recovery from $200 bottom
- 2019: Recovery from $3,200 bottom
- 2023: Recovery from $15,500 bottom
- 2027: Unknown
Why the cycle happens:
- Supply reduction: Halving cuts new Bitcoin supply → scarcity increases → price rises
- Speculation: People expect price to rise after halving → they buy early → self-fulfilling prophecy
- Leverage builds up: Bull market attracts leveraged traders → eventually liquidates → crash
- Psychological cycle: Greed → euphoria → fear → capitulation → hope → greed again
Is the 4-year cycle broken in 2026?
Arguments that it’s broken:
- 2025 was the first negative year after a halving: Every previous post-halving year was positive. 2025 was -6%. This breaks a 12-year pattern.
- ETFs changed market dynamics: Institutional money moves differently than retail. ETFs can bleed for months instead of panic dumping.
- Smaller supply shocks: In 2012, halving cut supply from 50 BTC to 25 BTC (50% reduction). In 2024, halving cut supply from 6.25 BTC to 3.125 BTC (still 50%, but much smaller absolute numbers). The impact diminishes each cycle.
- Macro factors matter more now: Bitcoin trades like a risk asset tied to Federal Reserve policy. Interest rates and liquidity matter more than halving schedules.
- Bitcoin hit all-time high BEFORE the April 2024 halving: This never happened before. In January 2024, Bitcoin hit new highs before the April halving. Previous cycles didn’t peak until 12-18 months AFTER the halving.
Arguments that the cycle still works (just evolved):
- The peak happened in October 2025, 18 months after the April 2024 halving: This matches the historical pattern. The crash in 2026 also matches the “Year 3 bear market” pattern.
- Percentage drops are smaller but the pattern remains: Previous cycles crashed 74-87%. This cycle is down 50%. But it’s still the same phase (Year 3 bear market).
- The mechanism hasn’t changed: Halving still reduces supply. Bitcoin still has a fixed 21 million supply cap. The fundamental scarcity mechanism works the same.
- Cycles are lengthening, not breaking: Instead of 4 years, it might be 5-6 years. The pattern could still hold but stretched over longer timeframes.
Where we are in February 2026:
- We’re 22 months after the April 2024 halving
- We’re 4 months into a 50% crash from the October 2025 peak
- If the pattern holds, we’re in the “Year 3 bear market” phase
- Next phase (accumulation/recovery) would start late 2026 or early 2027
- Next halving: April 2028
What history suggests happens next:
If the pattern repeats:
- 2026: Continued bear market, possible bottom at $40,000-$60,000
- 2027: Accumulation phase, slow recovery to $80,000-$100,000
- 2028: April halving, start of new bull market
- 2029-2030: New all-time high above $126,000
The realistic take: The 4-year cycle is more like a 4-5 year cycle now. The pattern is bending but not completely broken. The biggest change is institutional involvement creating steadier (less violent) moves up and down.
What this means for you: If you believe the cycle still works (even if modified), crashes are buying opportunities. If you think the cycle is dead, Bitcoin might never reach new highs again. Nobody knows which is right until 2028-2029.
Many investors start asking whether the market cycle has permanently ended after repeated drawdowns. To understand the real structural and macro reasons behind declines, review this analysis on crypto crashing before assuming long-term failure
What Should I Watch to Know If Crypto Will Recover?
Stop watching the price minute-by-minute. Watch these indicators instead.
Indicator #1: ETF flows (institutional money direction)
What to watch: Are Bitcoin ETFs bleeding money or accumulating?
Current status (February 2026): Outflows of $6.18 billion since November 2025
What recovery looks like: When ETF flows turn positive for 2-4 consecutive weeks, that signals institutions are buying again. The bottom in November 2022 was confirmed when ETFs (they didn’t exist yet, but institutional flows) turned positive.
How to track:
- Bloomberg ETF flow data
- CoinGlass ETF flow tracker
- BlackRock’s IBIT and Fidelity’s FBTC weekly reports
What it means: Institutions move slower than retail. When they start buying again, it’s usually a multi-month commitment, not a one-day pump.
Indicator #2: Corporate treasury behavior
What to watch: Are companies like Strategy, Marathon, and others buying or selling Bitcoin?
Current status (February 2026): 190+ companies hold 956,000 BTC. None have sold during the crash.
What recovery looks like: If companies start announcing new Bitcoin purchases, that’s a strong buy signal. If Strategy announces they’re selling Bitcoin to cover debt, that’s a major red flag.
How to track:
- Company earnings calls and SEC filings
- Bitcoin Treasuries website (tracks corporate Bitcoin holdings)
- Michael Saylor’s (Strategy CEO) Twitter/X account
What it means: Corporate treasuries are long-term holders. They don’t panic sell unless they’re forced. Their buying/selling is a better signal than retail panic.
Indicator #3: On-chain metrics (whale behavior)
What to watch: Are large Bitcoin holders (whales) accumulating or distributing?
Key metrics:
- Exchange reserves: Bitcoin sitting on exchanges (ready to sell) vs. Bitcoin in cold storage (held for long term)
- Whale accumulation: Wallets holding 1,000+ BTC adding to positions
- Long-term holder behavior: Bitcoin held for 6+ months without moving
Current status (February 2026): Exchange reserves are decreasing (bullish signal). Whales have reduced selling. Long-term holders haven’t panic-dumped.
What recovery looks like: When Bitcoin flows OUT of exchanges and INTO cold wallets, people are holding for long term. When whale wallets stop selling and start accumulating, bottom is near.
How to track:
- Glassnode (on-chain analytics platform)
- CryptoQuant (institutional-grade analytics)
- Whale Alert (tracks large transactions)
Indicator #4: Developer activity
What to watch: Are developers still building during the crash?
Current status (February 2026): Bitcoin and Ethereum GitHub activity remains steady. Lightning Network development continues. Layer 2 solutions (Polygon, Arbitrum, Optimism) keep shipping updates.
What recovery looks like: Strong developer activity during bear markets created the infrastructure for the next bull market. The Lightning Network was built in 2018-2019. Ethereum’s Merge happened in 2022. What gets built in 2026 could power 2028-2029.
How to track:
- Bitcoin GitHub repository (commits, pull requests)
- Ethereum GitHub
- Electric Capital’s annual developer report
What it means: Developers building during crashes shows long-term belief in the technology. When developers abandon projects, that’s when crypto is actually dying.
Indicator #5: Macro environment (Federal Reserve policy)
What to watch: Are interest rates rising or falling? Is global liquidity increasing or decreasing?
Current status (February 2026): Rates at 3.50-3.75%, Fed paused cuts. Kevin Warsh (tight money advocate) nominated for Fed Chair.
What recovery looks like: When the Fed starts cutting rates and increasing liquidity, risk assets (including Bitcoin) tend to rise. When rates stay high, Bitcoin struggles.
Key signals:
- Federal Reserve rate cuts
- Weakening US dollar
- Global M2 money supply increasing (more money flowing into economies)
How to track:
- Federal Reserve meeting minutes
- CME FedWatch Tool (predicts rate changes)
- US Dollar Index (DXY)
What it means: Bitcoin trades like a risk asset now. When macro conditions favor risk-taking, Bitcoin benefits. When conditions favor safety, Bitcoin suffers.
Indicator #6: Stablecoin supply
What to watch: Is stablecoin supply increasing or decreasing?
Current status (February 2026): Stablecoin supply remains high. USDT and USDC supply hasn’t collapsed.
What it means: Stablecoins are “dry powder” waiting to buy crypto. When people exit crypto, they often sell to stablecoins instead of exiting to dollars. High stablecoin supply = potential buying power ready to deploy.
What recovery looks like: When stablecoin supply starts flowing back into Bitcoin (USDT/USDC → BTC trades increase), that signals buying is returning.
How to track:
- Glassnode stablecoin supply chart
- Stablecoin market cap on CoinGecko
The complete recovery checklist:
✅ ETF flows turn positive for 2+ weeks ✅ Corporate treasuries start buying again ✅ Exchange reserves decrease (Bitcoin moving to cold storage) ✅ Whale accumulation increases ✅ Developer activity remains strong ✅ Federal Reserve cuts interest rates ✅ Stablecoin supply flows into Bitcoin
How many need to flip? You don’t need all seven. If 4-5 turn positive, recovery is likely starting.
Current count (February 2026):
- ❌ ETF flows: Still negative
- ✅ Corporate treasuries: Not selling
- ✅ Exchange reserves: Decreasing
- ⚠️ Whale behavior: Mixed
- ✅ Developer activity: Strong
- ❌ Fed policy: Rates held high
- ⚠️ Stablecoin supply: Stable but not flowing into BTC
Score: 3 out of 7 positive. We’re not at recovery yet, but we’re also not at capitulation (complete collapse).
Many investors start asking whether the market cycle has permanently ended after repeated drawdowns. To understand the real structural and macro reasons behind declines, review this analysis on crypto crashing before assuming long-term failure
How to Protect Yourself During Crypto Crashes (Real Rules, Not Clichés)
Rule #1: Never invest money you need within 5 years
Past Bitcoin crashes took 2-4 years to recover to previous highs. If you need this money for a house down payment in 2027, rent in 2028, or anything within 5 years, crypto is the wrong place.
Why 5 years specifically: The longest recovery period was 3.5 years (2014 crash didn’t hit new highs until late 2017). Adding buffer room gives you 5 years.
What to do: Before buying crypto, ask yourself: “If this dropped 80% and stayed there for 4 years, would I be financially okay?” If the answer is no, don’t buy.
Rule #2: Avoid leverage and margin trading
$3.25 billion in leveraged positions were liquidated in three weeks during this crash. Every single trader using 5x or higher leverage lost 100% of their money.
What leverage means: Borrowing money to buy more crypto. If you use 10x leverage, you control $10,000 worth of Bitcoin with $1,000. But if Bitcoin drops 10%, you lose everything.
The math: Bitcoin dropped from $98,000 to $72,000 (26% drop). Anyone using 4x leverage or higher got liquidated (lost everything).
What to do: Buy Bitcoin with your own money only. Never use margin, never use leverage, never borrow to buy crypto.
Exception: If you’re an experienced trader and use 2x leverage max with tight stop-losses, you might survive. But 95% of leveraged traders lose money. Don’t be that person.
Rule #3: Set automated buy orders during panic (dollar-cost averaging)
The best buying opportunities happen when you’re most scared. Automate it so emotions don’t interfere.
How it works:
- Set up automatic weekly or monthly Bitcoin purchases
- Buy $100, $500, or whatever you can afford
- Do this regardless of price
Example:
- January 2026: Buy $500 of Bitcoin at $90,000 = 0.0056 BTC
- February 2026: Buy $500 of Bitcoin at $65,000 = 0.0077 BTC
- Average cost: $77,500
If Bitcoin recovers to $100,000, you’re up 29%.
What NOT to do: Don’t try to time the bottom. You won’t catch $60,000 exactly. You might buy at $65,000, $70,000, and $60,000. That averages out better than going all-in at $70,000.
How to set it up:
- Coinbase: Recurring buy feature
- Swan Bitcoin: Automatic daily/weekly purchases
- Strike: Recurring purchases with low fees
Rule #4: Diversify beyond just crypto
If 80% of your portfolio is crypto, a 50% crash means you lose 40% of your total wealth. That’s devastating.
Proper allocation (conservative):
- 60% stocks (S&P 500 index fund)
- 20% bonds
- 10% real estate or other assets
- 10% crypto
Proper allocation (aggressive):
- 70% stocks
- 10% bonds
- 10% real estate
- 10% crypto
What NOT to do: Never go 50%+ into crypto unless you’re wealthy enough to lose it all without affecting your life.
The math: If you have $100,000 and put 10% ($10,000) in crypto, a 50% crypto crash costs you $5,000 total (5% of portfolio). Painful but survivable.
If you put 70% ($70,000) in crypto, a 50% crash costs you $35,000 (35% of portfolio). This could ruin your financial stability.
Rule #5: Use cold storage for long-term holdings
FTX collapsed in 2022. Customers lost $8 billion. If you held Bitcoin in your own wallet, you didn’t lose anything.
Cold storage options:
- Hardware wallets: Ledger, Trezor (costs $50-$200)
- Paper wallets: Write down your seed phrase, store it safely
- Multi-signature wallets: Requires multiple keys to move Bitcoin
The rule: If you’re holding for years, get it off exchanges. Exchanges can freeze withdrawals, get hacked, or go bankrupt.
What to do:
- Buy a Ledger or Trezor hardware wallet
- Transfer your Bitcoin from Coinbase/Kraken to the hardware wallet
- Store the seed phrase (12-24 word recovery phrase) in a safe place
- Never share your seed phrase with anyone (not even “customer support”)
What NOT to do: Don’t keep large amounts on exchanges. Exchanges are for trading, not long-term storage.
Rule #6: Ignore short-term price movements
Checking Bitcoin’s price 10 times a day destroys your mental health and leads to panic selling.
What to do:
- Check price once a week max
- Delete price alert apps during crashes
- Focus on long-term (3-5 year) goals
Why this works: The 2022 crash saw Bitcoin at $15,500. If you panic-sold there, you missed the rally to $126,000 (8x return). Those who ignored daily prices and held made massive gains.
Rule #7: Have an exit plan BEFORE you invest
Decide your exit strategy before emotions take over.
Example exit plans:
Plan A (profit-taking):
- Sell 20% if Bitcoin hits $150,000
- Sell another 20% if it hits $200,000
- Hold remaining 60% for long term
Plan B (stop-loss):
- Sell if Bitcoin drops below $50,000
- This limits loss to a predefined amount
Plan C (time-based):
- Hold until 2030 regardless of price
- Sell only if you need money for a specific goal (house, retirement)
What NOT to do: Don’t make decisions during panic. If Bitcoin drops to $55,000, having a pre-set rule (“I sell if it hits $50,000”) prevents emotional selling at $56,000.
Rule #8: Learn from this crash for the next cycle
Every crash teaches lessons. Document what you learned now.
Questions to ask yourself:
- Did I invest more than I could afford to lose?
- Did I panic when Bitcoin dropped 30%?
- Did I use leverage or margin?
- Did I diversify or go all-in on crypto?
- Did I sell at the bottom or hold?
What to do: Write down your answers. When the next bull market comes (2028-2029?), re-read this. Don’t repeat the same mistakes.
The protection checklist:
✅ Invested only money I don’t need for 5+ years ✅ Zero leverage, zero margin ✅ Automated weekly/monthly purchases ✅ Crypto is less than 20% of my portfolio ✅ Holdings are in cold storage (hardware wallet) ✅ I check price once a week maximum ✅ I have a pre-set exit plan ✅ I documented lessons learned for next cycle
If you can check all 8, you’re protected. Crashes hurt but won’t destroy you.
What Comes After This Crash? (Based on History, Not Hopes)
I can’t predict the future. But I can show what happened after previous crashes and let you make your own decision.
The pattern after 80%+ crashes:
2014-2015 Crash (87% drop):
- Bottom: $200 in January 2015
- 12 months later: $420 (2.1x from bottom)
- 24 months later: $970 (4.8x from bottom)
- 36 months later: $20,000 (100x from bottom)
2017-2018 Crash (84% drop):
- Bottom: $3,200 in December 2018
- 12 months later: $7,200 (2.25x from bottom)
- 24 months later: $19,000 (5.9x from bottom)
- 36 months later: $69,000 (21.5x from bottom)
2021-2022 Crash (77% drop):
- Bottom: $15,500 in November 2022
- 12 months later: $37,000 (2.4x from bottom)
- 24 months later: $69,000 (4.5x from bottom)
- 27 months later: $126,000 (8.1x from bottom)
The declining returns pattern:
- First recovery: 100x gain
- Second recovery: 21.5x gain
- Third recovery: 8.1x gain
Each cycle produces smaller multiples from the bottom.
What this suggests for the 2026 crash:
If Bitcoin bottomed at $60,000 in February 2026 (this is unknown):
- 12 months later (February 2027): $120,000-$150,000 (2-2.5x)
- 24 months later (February 2028): $180,000-$240,000 (3-4x)
- 36 months later (February 2029): $240,000-$360,000 (4-6x)
The realistic expectation: Following the declining returns pattern, a 3-5x gain from the bottom is possible by 2028-2029. If $60,000 is the bottom, that means $180,000-$300,000 peak.
The major assumption: This assumes the pattern repeats. It might not.
What gets built during bear markets:
2014-2015 bear market innovations:
- Ethereum launched (July 2015)
- Bitcoin’s block size debate (led to infrastructure improvements)
- Early hardware wallet development (Ledger, Trezor)
2018-2019 bear market innovations:
- Lightning Network development (Bitcoin payment layer)
- Decentralized finance (DeFi) protocols launched
- Binance became the dominant exchange
- Institutional infrastructure began (Bakkt, Fidelity Digital Assets)
2022-2023 bear market innovations:
- Ethereum’s Merge (switched to Proof of Stake)
- Layer 2 scaling solutions (Arbitrum, Optimism, Polygon)
- Bitcoin Ordinals (NFTs on Bitcoin)
- Bitcoin ETF applications submitted (approved January 2024)
What’s being built in 2026 (during this crash):
- Layer 2 Bitcoin solutions (Lightning Network improvements, Bitcoin sidechains)
- Bitcoin-backed DeFi protocols
- Institutional custody solutions
- Stablecoin payment infrastructure
- Bitcoin mining efficiency improvements
- ETF infrastructure maturing
Why this matters: The infrastructure built during bear markets powers the next bull market. The innovations from 2026 could drive adoption in 2028-2030.
Timeline expectations based on past cycles:
If the pattern holds:
- February-December 2026: Continued bear market, possible lower lows
- Q1 2027: Capitulation bottom (maximum fear, lowest prices)
- Q2-Q4 2027: Accumulation phase (prices stabilize, volatility decreases)
- Q1 2028: April halving occurs
- Q2 2028-Q4 2028: Post-halving rally begins
- 2029: Potential new all-time high
- 2030: Possible cycle peak
If the pattern breaks:
- Bitcoin could stay range-bound ($50,000-$80,000) for years
- The 4-year cycle could be dead
- Institutional involvement creates permanent lower volatility
- New all-time highs might never occur
The three scenarios for 2026-2030:
Scenario 1 – Bull case (pattern repeats):
- Bottom: $60,000 (February 2026)
- Recovery: $120,000 (2027)
- New ATH: $200,000+ (2029)
- Probability: 40% (based on historical success rate)
Scenario 2 – Moderate case (modified cycle):
- Bottom: $50,000 (late 2026)
- Slow recovery: $90,000 (2028)
- Modest new high: $150,000 (2030)
- Probability: 35%
Scenario 3 – Bear case (cycle broken):
- Lower low: $40,000 (2026-2027)
- Extended range: $40,000-$80,000 (2027-2030)
- No new ATH
- Probability: 25%
What professional investors are watching:
Bullish signals:
- ETF flows turn positive
- Federal Reserve cuts rates 3+ times in 2026-2027
- Corporate treasuries resume Bitcoin purchases
- Developer activity remains strong
- Halving in April 2028 creates supply shock
Bearish signals:
- ETF flows stay negative through 2026
- Interest rates stay high (above 3.5%)
- Corporate treasuries forced to sell (Strategy sells Bitcoin to cover debt)
- Major security breach or technology failure
- Regulatory crackdown globally
The honest conclusion:
I cannot tell you what comes next. History suggests recovery in 2-4 years with returns of 3-5x from the bottom. But history can break.
What you should do:
✅ Make decisions based on your personal situation, not predictions ✅ Only invest money you can lose ✅ Understand that 2-4 year timelines mean no guarantees until 2028-2030 ✅ Watch the indicators (ETF flows, Fed policy, corporate behavior) ✅ Accept that this could be the end OR another cycle
The final truth: “Is crypto dead?” has been asked 463 times. Bitcoin answered by recovering every time. But 463 recoveries don’t guarantee a 464th. This crash could be different—or it could be exactly the same as before. Nobody knows until 2028-2030.
Make your decision based on what you can afford to lose and how long you can wait. That’s the only honest answer.

Financial Analyst Iqra Zahoor provides data-driven crypto analysis & strategies. Guiding you from market trends to informed investment decisions.