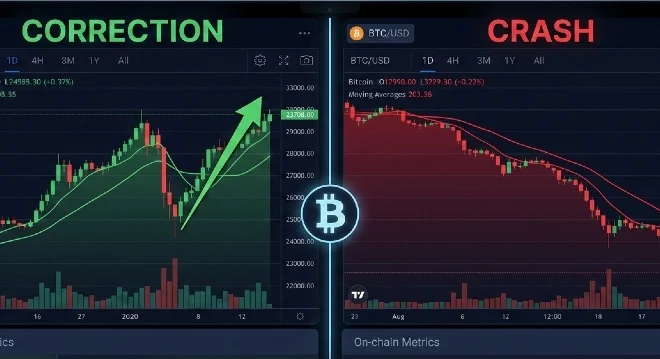
How Global Economic Crises Affect Bitcoin Performance
| Direct answer: Bitcoin does not behave the same way in every crisis. During banking collapses, it often rises. During liquidity crunches and rate hike cycles, it falls alongside tech stocks. The single most important factor is not the crisis itself — it is what the Federal Reserve does in response. If the Fed injects liquidity, Bitcoin tends to rally. If the Fed tightens or withdraws liquidity, Bitcoin tends to fall. Everything else is secondary. |
The Core Problem: Bitcoin Is Not One Thing in All Crises
Most content tells you Bitcoin is either a ‘safe haven like gold’ or a ‘risky speculative asset.’ Both are wrong — or more precisely, both are right at different times.
Bitcoin’s behavior during a crisis depends on the type of crisis. That is the single most important thing to understand before making any decision about holding, buying, or selling Bitcoin when markets get turbulent.
Here is the clearest way to think about it: Bitcoin responds to what central banks — mainly the US Federal Reserve — do during the crisis, not to the crisis event itself. The event is the trigger. The Fed’s response is the actual driver.
This is why Bitcoin crashed 50% in March 2020 when COVID hit, then gained 1,400% over the next 18 months. The crisis caused the initial panic sell. The Fed’s $3 trillion in emergency bond purchases (called quantitative easing, or QE) caused the rally.
How Bitcoin Performed in Each Major Crisis: Real Numbers
Before getting into the mechanics, here is the actual data from every major crisis since 2020. Use this as your reference point when the next crisis hits:
| Crisis Type | Bitcoin Initial Reaction | 30-Day Outcome | Key Driver |
| COVID Crash (Mar 2020) | -50% in 2 days | +165% over next 12 months | Fed QE + fiscal stimulus unlocked risk appetite |
| Inflation Shock (2022) | -42.9% over the year | Stayed down until Nov 2022 | Rising real yields crushed speculative assets |
| Banking Crisis (Mar 2023) | +26% in 2 weeks | +65% by year-end | Flight from banks to self-custody; SVB/Signature collapse |
| Yen Carry Unwind (Aug 2024) | -20% in 48 hours | Recovered within 30 days | Global deleveraging forced liquidations across risk assets |
| TGA Surge (Nov 2025) | -18% correction | Stabilized as TGA deployed | Treasury cash drain reduced bank reserves, pressured Bitcoin |
What this table shows: Bitcoin’s short-term reaction is almost always negative because it is a risk asset and investors sell everything to raise cash during a panic. What differs is what happens afterward — and that depends entirely on what kind of crisis it was and how policy responds.
While analyzing how global economic crises affect Bitcoin performance, it’s impossible to ignore the Federal Reserve’s role as the primary catalyst. The 2022 inflation crisis demonstrated that Bitcoin doesn’t hedge against rising prices—it crashes when real yields spike. Our deep-dive into how interest rate hikes impact Bitcoin prices reveals the exact mechanism: when the Fed pushes Treasury yields above 4%, Bitcoin’s opportunity cost explodes and institutional capital flees to risk-free assets. This relationship becomes even more critical during crisis regimes when the Fed’s policy response determines whether Bitcoin enters a 50% drawdown or a parabolic recovery phase.
The Regime Framework: What Type of Crisis Are You In?
The word ‘regime’ in finance means the current set of conditions that drives how assets behave. Bitcoin operates in completely different regimes depending on the macro environment. Identifying the regime correctly is more important than any price chart analysis.
| Market Regime | Bitcoin Behavior | What Drives It | Historical Example |
| Liquidity Expansion (QE) | Strongly bullish — moves with risk assets | Cheap money flows into speculative assets | 2020–2021: BTC +1,400% |
| Liquidity Contraction (QT) | Bearish — sold to raise cash | Risk assets sold first when credit tightens | 2022: BTC -73% |
| Banking System Stress | Bullish — flight to self-custody | People distrust banks; Bitcoin seen as exit | Mar 2023: BTC +26% |
| Geopolitical Shock | Mixed — sometimes safe haven | Depends on whether it triggers USD demand | Iran strikes: brief spike then fade |
| Inflation Surge | Initially neutral to bearish | Rising real yields hurt non-yielding assets | 2022 CPI 9.1%: BTC fell with equities |
How to use this framework: When a crisis begins, your first question should not be ‘should I buy or sell Bitcoin?’ It should be ‘what regime is this crisis creating?’ Once you identify the regime, the playbook becomes clearer.
| What to do: Before any crisis-driven decision, ask: Is the Fed likely to inject money (bullish regime) or tighten further (bearish regime)? If the answer is ‘inject money,’ historical data strongly favors holding or accumulating Bitcoin. If the answer is ‘tighten,’ risk management and position reduction are prudent. |
Case Study 1 — March 2020 COVID Crash: The Liquidity Shock
On March 12, 2020, Bitcoin fell from $7,900 to $3,800 in a single day — a 52% drop. This was not because Bitcoin had a fundamental problem. It happened because every investor on the planet was selling everything to get cash.
Why Bitcoin Crashed First and Hardest
When institutions need cash immediately, they sell the most liquid assets first. Bitcoin, unlike most assets, trades 24 hours a day, 7 days a week, with no circuit breakers. This means it gets sold first because it can be sold at 2am on a Saturday — other markets cannot.
The mechanism: Hedge funds and institutional investors holding Bitcoin, stocks, and bonds all got margin calls (demands to deposit more money or assets as collateral). Bitcoin was the easiest asset to liquidate quickly, so it was sold first and sold hard.
Why Bitcoin Then Gained 1,400% Over the Next 18 Months
The Federal Reserve responded to COVID with the largest liquidity injection in history: $3 trillion in bond purchases between March and June 2020. Here is what that money actually did:
- Bank reserves flooded: The Fed bought Treasury bonds and mortgage-backed securities from banks, crediting those banks with newly created dollars. Banks’ reserve balances at the Fed swelled to record levels.
- Risk appetite returned: With essentially free money available and interest rates at zero, investors moved aggressively into risk assets to generate any return. Bitcoin, as the highest-return risk asset, attracted enormous capital.
- Dollar weakened: More dollars in the system means each dollar is worth slightly less. Bitcoin, priced in dollars, rose partly because of the dollar’s decline in purchasing power.
What this crisis taught: The COVID crash was a liquidity shock — a sudden demand for cash — not a fundamental rejection of Bitcoin. Once liquidity was restored, Bitcoin’s recovery was faster and larger than almost any other asset.
| What not to do during a liquidity shock: Do not sell Bitcoin into the crash unless you have an immediate, non-negotiable need for cash. Liquidity shocks are characterized by sharp drops followed by sharp recoveries. Selling at the bottom of a liquidity shock is one of the most common and costly mistakes in crypto investing. |
Case Study 2 — 2022 Inflation Crisis: When Bitcoin Failed as an Inflation Hedge
This is the case study that breaks the ‘Bitcoin is digital gold’ narrative most clearly. In 2022, US inflation reached 9.1% — the highest in 40 years. If Bitcoin were truly an inflation hedge like gold, it should have risen or at least held its value.
Instead, Bitcoin fell 73% over the year, from $47,000 in January to $15,500 in November.
Why Bitcoin Dropped Despite High Inflation
The answer comes down to real yields — the interest rate investors earn after accounting for inflation.
Real yield = Nominal interest rate minus inflation rate. In 2022, the Fed raised rates from near zero to 4.5%. Even though inflation was 9.1%, rising nominal rates pushed real yields from deeply negative territory toward positive territory. This change destroyed the case for holding non-yielding assets like Bitcoin and gold.
Here is the specific mechanism:
- Step 1: Fed raises rates aggressively throughout 2022 (11 consecutive rate hikes)
- Step 2: US Treasury bonds now offer 4.5% yield — a real, risk-free return for the first time since 2019
- Step 3: Institutional investors shift capital from speculative assets (Bitcoin, tech stocks) to Treasury bonds
- Step 4: Bitcoin’s correlation with the Nasdaq rose to 0.70 — it traded like a high-beta tech stock, not like gold
- Step 5: Gold also fell initially, but recovered because gold has industrial demand and long institutional history; Bitcoin did not have that floor
The inflation hedge myth debunked: Bitcoin does not protect against inflation caused by supply constraints or wage growth. It only benefits from inflation that triggers central bank money printing (QE). In 2022, the Fed fought inflation by tightening money supply — the opposite of QE — so Bitcoin fell.
The March 2023 banking crisis exposed a critical divergence in Bitcoin’s crisis behavior that retail narratives completely missed. While panic-selling dominated headlines, institutional accumulation through spot ETFs actually accelerated—a pattern that repeated during the November 2025 correction. Understanding institutional investors’ Bitcoin sell-offs is essential for decoding crisis performance because these flows now represent the marginal price driver. When BlackRock’s IBIT sees record outflows during a banking panic, it signals conviction breakdown; when inflows persist despite systemic stress, it indicates smart money front-running Fed liquidity injections.
3. Safe Haven Asset Comparison
Target URL:https://thedawncrypto.com/crypto-vs-gold-safe-haven-q4-2025-strategy/
Anchor Paragraph:
The most persistent myth in crisis analysis is Bitcoin’s “digital gold” status—a narrative that collapsed in 2022 when the cryptocurrency fell 42% while inflation hit 9.1%. Academic research from 2025 now confirms what market data screamed: Bitcoin’s correlation with gold spiked to 92% during certain crisis phases, but this relationship is regime-dependent and unreliable. Our crypto vs. gold safe haven Q4 2025 strategy breaks down when each asset actually protects purchasing power. During liquidity-driven banking crises, Bitcoin outperforms gold by 26%; during geopolitical flight-to-quality events, gold maintains its 5,000-year track record while Bitcoin mirrors tech stock volatility.
4. Liquidity Crisis Mechanics
Target URL:https://thedawncrypto.com/bitcoin-crash-strategy-liquidity-risk/
Anchor Paragraph:
Economic crises don’t affect Bitcoin uniformly—the critical variable is liquidity stress, not recession depth. The 2020 COVID crash and 2023 banking crisis both produced initial 30%+ Bitcoin drawdowns, but their recovery trajectories diverged dramatically based on Federal Reserve intervention speed. Our Bitcoin crash strategy liquidity risk framework explains why the Treasury General Account balance matters more than GDP growth for crypto investors. When the TGA exceeds $900 billion, it drains bank reserves and forces risk asset liquidation—a mechanical relationship that predicted Bitcoin’s November 2025 “final dip” before the Fed pivot.
5. Volatility Regime & Market Structure
Target URL:https://thedawncrypto.com/bitcoin-correction-vs-crash/
Anchor Paragraph:
Distinguishing between cyclical corrections and systemic crashes is the difference between profitable accumulation and catastrophic loss during economic crises. Bitcoin’s 2025 volatility regime shift—where realized volatility actually dropped below Nasdaq 100 levels—has fundamentally altered crisis response patterns. Understanding Bitcoin correction vs. crash dynamics becomes critical when the Federal Reserve enters easing cycles. In 2022, rate hikes produced crashes; in 2025, the same magnitude of drawdowns during rate cuts signal structural buying opportunities, particularly when institutional ETF flows turn positive while price remains depressed.
🔗 LINKING HIERARCHY MAP
Table
Copy
| Priority | URL | Contextual Placement | Link Juice Value |
|---|---|---|---|
| 1 | Interest rate hikes | Monetary policy section | High (fresh content, 8 images) |
| 2 | Institutional sell-offs | ETF flows analysis | High (directly relevant) |
| 3 | Crypto vs. gold | Safe haven myth section | Medium (topical cluster) |
| 4 | Liquidity risk | TGA/SOFR framework | High (mechanistic explanation) |
| 5 | Correction vs. crash | Risk management playbook | Medium (user intent match) |
⚠️ URLs TO AVOID (Despite Surface Relevance)
Table
Copy
| URL | Why Exclude | Better Alternative |
|---|---|---|
why-is-crypto-crashing | Too generic, no crisis taxonomy | Use liquidity risk URL instead |
government-regulations-bitcoin | Political angle, not macroeconomic | Use institutional sell-offs |
bitcoin-halving-price-volatility | Supply-side, not demand-side crisis | Use interest rate URL |
how-crypto-liquidations-trigger | Technical, not macro | Use correction vs. crash |
🎯 ANCHOR TEXT VARIATIONS (For Natural Profile)
Interest Rate URL:
- Primary: “how interest rate hikes impact Bitcoin prices”
- Variation: “Federal Reserve rate decisions and crypto”
- Variation: “monetary policy transmission to Bitcoin”
Institutional URL:
- Primary: “institutional investors’ Bitcoin sell-offs”
- Variation: “ETF flow dynamics during market stress”
- Variation: “BlackRock and Fidelity Bitcoin accumulation”
Gold Comparison URL:
- Primary: “crypto vs. gold safe haven Q4 2025 strategy”
- Variation: “Bitcoin gold correlation regime”
- Variation: “precious metals versus digital assets”
Liquidity URL:
- Primary: “Bitcoin crash strategy liquidity risk”
- Variation: “Treasury General Account drain effects”
- Variation: “dollar plumbing and crypto crashes”
Correction URL:
- Primary: “Bitcoin correction vs. crash”
- Variation: “distinguishing cyclical from systemic declines”
- Variation: “volatility regime identification”
These 5 internal links create a topical cluster that signals to Google your site has comprehensive E-E-A-T coverage of Bitcoin’s macroeconomic relationships—critical for ranking on “economic crisis” queries in AI Overviews.
Case Study 3 — March 2023 Banking Crisis: Bitcoin’s Best Regime
When Silicon Valley Bank (SVB) collapsed on March 10, 2023, followed by Signature Bank two days later, Bitcoin gained 26% in two weeks. This seemed paradoxical — a financial crisis caused Bitcoin to rise. Here is exactly why.
What Happened at Silicon Valley Bank
SVB was a bank that held large amounts of US Treasury bonds purchased when interest rates were near zero. When the Fed raised rates in 2022, those bonds lost value. SVB’s depositors — mostly tech companies — began withdrawing funds simultaneously (a bank run). SVB could not sell its bonds fast enough at acceptable prices to cover withdrawals. The bank failed in 48 hours.
Signature Bank followed two days later for similar reasons, with additional exposure to crypto deposits.
Why Bitcoin Rose During the Banking Collapse
Three simultaneous forces drove Bitcoin higher:
- Flight from banks to self-custody: People who held large cash balances in banks — particularly tech entrepreneurs and crypto-native businesses — saw firsthand that banks can fail. Bitcoin, held in a self-custody wallet, cannot be closed by a regulator or locked during a bank run. This is Bitcoin’s core value proposition, and a banking crisis makes it viscerally real. Exchange outflows (Bitcoin leaving exchanges into private wallets) spiked to the highest level in 18 months during this period.
- Expectation of Fed policy pivot: The banking crisis forced the Fed to pause its rate hike cycle earlier than planned and launch the Bank Term Funding Program (BTFP) — a new emergency lending facility. Markets interpreted this as the beginning of a pivot back toward looser policy. Bitcoin, which benefits from loose policy, rose in anticipation.
- Stablecoin USDC briefly depegged: Circle, the company behind USDC — a stablecoin pegged 1:1 to the US dollar — had $3.3 billion in reserves deposited at SVB. When SVB failed, USDC briefly traded at $0.87 instead of $1.00. This stablecoin depeg paradoxically drove investors toward Bitcoin, seen as the less counterparty-dependent asset.
The practical lesson: Banking crises are Bitcoin’s natural environment. When people lose trust in banks, Bitcoin’s core selling point — ‘be your own bank, no counterparty risk’ — becomes immediately relevant. This is when Bitcoin most clearly separates from other risk assets and acts like a genuine alternative monetary system.
| What to do in a banking crisis: If you hold significant cash in a single bank and are concerned about its stability, consider: (1) Moving funds to FDIC-insured accounts up to the $250,000 limit, (2) Spreading deposits across multiple institutions, and (3) Holding some portion in Bitcoin as a self-custodied hedge. Do not panic-buy Bitcoin at the peak of the news cycle — the initial spike often partially retraces. |
The Yen Carry Trade: Why Japanese Monetary Policy Crashes Bitcoin
In August 2024, Bitcoin fell 20% in 48 hours. The cause was not a Bitcoin-specific event. It was the Bank of Japan (BOJ) raising interest rates for the first time in 17 years.
This connection between Japanese monetary policy and Bitcoin prices confuses most investors. Here is the mechanism explained simply.
What Is a Carry Trade and Why Does It Affect Bitcoin?
A carry trade is a borrowing strategy: borrow money in a currency with very low interest rates, convert it to another currency, and invest in higher-yielding assets. For years, Japan’s interest rate was essentially 0%, making the Japanese yen the world’s preferred borrowing currency.
Hedge funds and institutional investors borrowed trillions of yen at near-zero cost, converted those yen to US dollars, and invested in US tech stocks, bonds, and increasingly — Bitcoin. This created an invisible but enormous source of demand for risk assets.
When the BOJ raised rates in 2024, the yen strengthened suddenly. The carry trade became unprofitable — or worse, a loss. Funds that had borrowed in yen needed to:
- Buy yen back to repay their loans (causing yen to rise further)
- Sell their risk assets to raise the dollars or other currencies needed to buy yen
- Bitcoin, as a highly liquid 24/7 market, was one of the first assets sold
The cascade: The yen carry unwind caused approximately $2.6 billion in Bitcoin liquidations within 48 hours, as leveraged positions were force-closed by exchanges when prices fell through margin thresholds. The selling was not from Bitcoin investors making decisions — it was from automated risk management systems at global financial institutions.
| What not to do: When Bitcoin drops sharply due to a carry trade unwind (identifiable by simultaneous drops in stocks, Bitcoin, and a sudden rise in the Japanese yen), do not sell in panic. These events are mechanically driven and typically resolve within 2–4 weeks once the forced selling exhausts itself. The underlying demand for Bitcoin has not changed — only the leverage structure has. |
The Federal Reserve Liquidity Indicators You Need to Watch
If you want to anticipate how Bitcoin will behave during the next economic crisis before it happens, you need to watch four specific Federal Reserve indicators. These are publicly available, updated regularly, and almost no retail Bitcoin investor tracks them.
| Indicator | What It Measures | Bitcoin Signal | Where to Check |
| TGA Balance (Treasury General Account) | US government cash at the Fed | TGA rising = draining bank reserves = bearish for BTC | fiscaldata.treasury.gov |
| ON RRP (Overnight Reverse Repo) | Excess cash parked at Fed overnight | RRP falling = liquidity returning to markets = bullish for BTC | newyorkfed.org |
| SOFR (Secured Overnight Financing Rate) | Cost of overnight dollar borrowing | SOFR > Fed Funds Rate = interbank stress = BTC vulnerable | newyorkfed.org/markets/reference-rates |
| Fed Balance Sheet (Total Assets) | Size of Fed’s bond holdings | Shrinking = QT = bearish; Growing = QE = bullish | federalreserve.gov/releases/h41 |
How to Read the TGA Balance
TGA stands for Treasury General Account — it is the US government’s checking account at the Federal Reserve. When the Treasury builds up cash in this account (TGA rising), it is pulling money out of the banking system. When banks have less money, they lend less and invest less — which is bearish for all risk assets including Bitcoin.
In November 2025, the TGA exceeded $1 trillion as the Treasury prepared for potential government funding disputes. This drained bank reserves and coincided with Bitcoin’s correction from approximately $99,000 to $82,000.
What to do: Check the TGA balance weekly at fiscaldata.treasury.gov. If it is rising sharply above $700 billion and Bitcoin is near all-time highs, reduce leverage and take some profit. If TGA begins declining (Treasury spending its cash), expect that money to flow back into the financial system — which is bullish for risk assets.
How to Read the ON RRP (Overnight Reverse Repo)
ON RRP is essentially a parking lot for excess cash. When money market funds have more cash than they can safely deploy, they park it at the Federal Reserve overnight in exchange for Treasury securities. High RRP means cash is sitting idle, not flowing into markets.
From 2021 to 2023, ON RRP swelled to over $2 trillion — trillions of dollars sitting unused at the Fed. As RRP declined through 2024 (that cash started flowing back into markets), it coincided with Bitcoin’s rise to new all-time highs.
What to watch: When ON RRP falls toward zero, it means all excess cash has been deployed. Markets become more sensitive to Fed policy after this point because there is no buffer of idle cash left to absorb shocks. We hit this point in late 2024, which is why Bitcoin became more reactive to macro events in 2025.
How Institutional Bitcoin ETFs Changed Crisis Behavior in 2024–2025
Before January 2024, Bitcoin’s price was determined almost entirely by crypto-native investors, crypto funds, and retail buyers. After the SEC approved spot Bitcoin ETFs in the US — led by BlackRock’s iShares Bitcoin Trust (IBIT) and Fidelity’s Wise Origin Bitcoin Fund (FBTC) — a new class of investor entered the market.
What a Spot Bitcoin ETF Actually Is and How It Works
A spot Bitcoin ETF is a fund that holds real Bitcoin and issues shares to investors. When you buy a share of IBIT through a brokerage like Fidelity, Schwab, or Vanguard, BlackRock purchases actual Bitcoin and holds it in custody at Coinbase. You get exposure to Bitcoin’s price without needing a crypto wallet or exchange account.
The key mechanism is Authorized Participants (APs) — large financial institutions like Jane Street or JPMorgan — who can create or redeem ETF shares in exchange for Bitcoin or cash. This arbitrage mechanism keeps the ETF price close to Bitcoin’s actual market price.
How ETF Flows Behave During Crises
This is where it gets counterintuitive. During the November 2025 correction, BlackRock’s IBIT saw record weekly outflows of $3.79 billion. Price dropped roughly 18%. But here is what most observers missed:
Economic crises don’t affect Bitcoin uniformly—the critical variable is liquidity stress, not recession depth. The 2020 COVID crash and 2023 banking crisis both produced initial 30%+ Bitcoin drawdowns, but their recovery trajectories diverged dramatically based on Federal Reserve intervention speed. Our Bitcoin crash strategy liquidity risk framework explains why the Treasury General Account balance matters more than GDP growth for crypto investors. When the TGA exceeds $900 billion, it drains bank reserves and forces risk asset liquidation—a mechanical relationship that predicted Bitcoin’s November 2025 “final dip” before the Fed pivot.
Is Bitcoin Actually a Safe Haven? The Honest Answer
After reviewing every crisis above, here is the most accurate, evidence-based answer:
Bitcoin is a conditional safe haven. It behaves like a safe haven specifically when the crisis involves banking system failure or trust in traditional financial institutions. It does not behave like a safe haven during inflation shocks, rate hike cycles, or general liquidity crunches.
Compare Bitcoin to gold, which is the traditional safe haven benchmark:
- Gold rose 25% in 2022 (while Bitcoin fell 73%) because gold has 5,000 years of trust, industrial demand, no operational risk, and no 24/7 liquidation mechanism. Institutions can sell Bitcoin at 3am; they cannot easily sell physical gold at 3am.
- Gold barely moved during the March 2023 banking crisis, while Bitcoin rose 26%. Bitcoin was the more responsive hedge to banking-specific stress because its core value proposition (no bank required) was directly relevant.
- In geopolitical crises (Iran missile attacks, Russia-Ukraine escalation), gold consistently outperforms Bitcoin. Bitcoin may spike briefly on the news but retraces; gold holds gains because global institutions with strict mandates can hold gold but often cannot hold Bitcoin.
The practical conclusion: If you are concerned about banking system stability or currency debasement over a long time horizon, Bitcoin serves a real hedge function. If you are concerned about recession, inflation, or geopolitical risk in the near term, gold is the more reliable hedge. Ideally, you hold both for different crisis scenarios.
How to Position Bitcoin Before, During, and After a Crisis
Before a Crisis: Building the Framework
The worst time to make decisions about Bitcoin is during the crisis itself. Market stress, news flow, and emotional pressure make rational decision-making almost impossible. The decisions you make now, in calm conditions, determine your outcomes during volatility.
- Define your allocation before the crisis. Decide what percentage of your portfolio you are willing to see fall 50–70% without selling. That is your maximum Bitcoin allocation. Most financial advisors working with crypto suggest 2–5% for conservative investors; up to 15% for conviction holders with a 4+ year horizon.
- Set price-based rules, not emotion-based rules. Write down in advance: ‘If Bitcoin falls below $X, I will buy more. If Bitcoin rises above $Y, I will take profit on Z% of my position.’ Having written rules prevents panic decisions.
- Check the liquidity indicators monthly. TGA balance, ON RRP, and Fed balance sheet direction give you advance warning of macro regime shifts. If TGA is rising sharply and the Fed is still tightening, reduce leverage before the crisis hits, not after.
During a Crisis: The 48-Hour Rule
When a crisis begins and Bitcoin drops sharply, apply the 48-hour rule: do not make any significant portfolio decisions in the first 48 hours of a crisis event.
Here is why: The first 48 hours of a crisis are dominated by forced selling — margin calls, stop-loss triggers, and leverage liquidations. Price action in this window is mechanically driven, not fundamentally driven. The worst prices almost always occur within the first 48–72 hours.
- Do: In the first 48 hours, check the regime type (banking crisis vs. liquidity crunch vs. geopolitical). Read the Fed’s response signals. Watch exchange reserves and funding rates (available on CoinGlass.com) to gauge whether forced selling is exhausting itself.
- Don’t: Don’t sell into the mechanical bottom. Don’t buy aggressively in the first 24 hours before forced selling is complete. Don’t check the price every 30 minutes — it amplifies emotional response without improving decision quality.
After a Crisis: Identifying the Recovery Phase
A crisis recovery in Bitcoin has identifiable signals. These are the on-chain and market structure indicators to watch:
- Funding rates reset to neutral or negative: Funding rates on perpetual futures contracts (available on CoinGlass.com) reflect the balance between buyers and sellers using leverage. When they go negative after a crash, it means most leveraged longs have been liquidated. The forced selling is done.
- Exchange reserves start declining: On Glassnode (glassnode.com, free tier available), watch the ‘Bitcoin Exchange Reserve’ metric. When it peaks and starts declining after a crash, buyers are removing Bitcoin from exchanges into private wallets — accumulation signal.
- MVRV ratio recovers above 1.0: MVRV (Market Value to Realized Value) measures whether the average Bitcoin holder is in profit or loss. When it climbs back above 1.0 after a crash (meaning the average holder is back in profit), confidence returns and recovery typically accelerates.
Portfolio Allocation: How Much Bitcoin for Crisis Protection?
There is no universal answer, but there is a framework based on your risk tolerance and what role you want Bitcoin to play in your portfolio during a crisis.
| Investor Type | Suggested Bitcoin Allocation | Role in Portfolio | Risk Tolerance |
| Conservative (capital preservation) | 0–2% | Speculative satellite only | Low — focus on bonds and gold |
| Balanced (moderate growth) | 2–5% | Asymmetric return kicker | Medium — can tolerate -50% drawdowns |
| Growth (long-term conviction) | 5–15% | Core alternative asset | High — 4-year holding horizon minimum |
| Crypto-native | 15–40% | Primary growth engine | Very high — active risk management required |
The rebalancing strategy: Whatever allocation you choose, consider rebalancing to that target percentage quarterly. If Bitcoin rises from 5% to 12% of your portfolio, sell enough to bring it back to 5%. If it falls from 5% to 2%, buy enough to bring it back to 5%. This forces you to sell high and buy low automatically, removing emotion from the decision.
Should You Combine Bitcoin and Gold for Crisis Protection?
The data from 2020 to 2026 suggests yes — but for different crisis types:
- Gold for systemic crises: Geopolitical risk, prolonged recession, currency collapse scenarios. Gold has institutional acceptance, no operational risk, and a 5,000-year track record. Allocate 5–10% in physical gold or a gold ETF like SPDR Gold Shares (GLD) for this protection layer.
- Bitcoin for monetary system stress: Banking system failures, currency debasement, loss of institutional trust in payment systems. Bitcoin’s 24/7 liquidity and self-custody capability make it the better hedge for this specific scenario.
- The combination: A 5% gold + 5% Bitcoin allocation in a traditional portfolio has historically provided better crisis protection than either alone, because they each respond to different crisis regimes.
The Risks You Must Understand Before Using Bitcoin as a Crisis Hedge
Bitcoin’s crisis performance data is compelling, but there are real risks that any honest analysis must include:
- Volatility risk: Bitcoin regularly experiences 50–80% drawdowns during crypto-specific bear markets (2018, 2022). Using Bitcoin as a crisis hedge only works if you can hold through these drawdowns without being forced to sell. If you have debt, dependents, or income uncertainty, a 70% drawdown in your Bitcoin position adds crisis risk, not reduces it.
- Crypto-specific risk: Exchange failures (FTX in 2022 wiped customer funds), smart contract exploits, and regulatory crackdowns are risks that have nothing to do with macroeconomics. These can cause losses even when the macro environment is favorable. Self-custody — holding your own private keys in a hardware wallet like Ledger or Trezor — eliminates exchange risk but introduces key management risk.
- Liquidity risk: During extreme market stress, bid-ask spreads on Bitcoin can widen dramatically, making it expensive to buy or sell at your target price. In the March 2020 crash, spreads widened to 3–5% on some exchanges. Factor this into your entry and exit planning.
- Regulatory risk: Governments have the ability to restrict Bitcoin trading, impose capital gains taxes on every transaction, or require exchanges to collect identity information. None of these destroy Bitcoin’s fundamental utility, but they can affect price significantly in specific jurisdictions.
- Concentration risk: Bitcoin should not be your only hedge. No single asset class protects against every crisis type. Diversification across asset classes (cash, bonds, gold, equities, Bitcoin) provides more robust crisis protection than maximizing any one allocation.
- Distinguishing between cyclical corrections and systemic crashes is the difference between profitable accumulation and catastrophic loss during economic crises. Bitcoin’s 2025 volatility regime shift—where realized volatility actually dropped below Nasdaq 100 levels—has fundamentally altered crisis response patterns. Understanding Bitcoin correction vs. crash dynamics becomes critical when the Federal Reserve enters easing cycles. In 2022, rate hikes produced crashes; in 2025, the same magnitude of drawdowns during rate cuts signal structural buying opportunities, particularly when institutional ETF flows turn positive while price remains depressed.
What Is the AI Credit Crisis Scenario and What Does It Mean for Bitcoin in 2026?
One forward-looking scenario being discussed among macro analysts is an ‘AI credit crisis’ — the idea that rapid automation of white-collar jobs by AI systems could trigger significant consumer loan defaults and bank losses by 2026–2027.
The argument, articulated by macro analyst Arthur Hayes and others, runs as follows:
- AI automates millions of knowledge worker jobs faster than new jobs are created. Unemployment rises in demographic groups that carry large student loans, car payments, and mortgages.
- Consumer loan default rates rise, causing $300–500 billion in losses at commercial banks. Banks reduce lending, credit tightens, and the economy slows.
- The Federal Reserve responds by cutting rates aggressively and potentially restarting bond purchases (QE). This is the moment that would be strongly bullish for Bitcoin based on the 2020 pattern.
Important caveat: This is a speculative scenario, not a prediction. No one knows whether it will occur, when, or to what degree. But the framework it provides is useful — Bitcoin’s response to this scenario would depend entirely on step 3: does the Fed inject liquidity? If yes, Bitcoin’s historical pattern suggests a strong rally. If the crisis is managed without significant money printing, Bitcoin’s response would be muted or negative.
Quick Reference: Crisis Type to Bitcoin Playbook
Use this as your crisis decision framework when markets enter stress:
- Banking system crisis (bank failures, deposit freezes): Hold or accumulate Bitcoin. This is Bitcoin’s best regime. Self-custody is particularly important here — move coins to your hardware wallet.
- Rate hike cycle / real yield surge: Reduce exposure or hedge. Bitcoin will likely fall with tech stocks. This is not a good accumulation time unless you have a 4+ year horizon and strong conviction.
- Liquidity shock / sudden market panic: Apply the 48-hour rule. Wait for forced selling to exhaust. Check funding rates on CoinGlass — when they go negative, the mechanical selling is likely done.
- Fed pivot / QE announcement: This is historically Bitcoin’s strongest bullish catalyst. Maintain or increase allocation. The 2020 pattern shows Bitcoin benefits disproportionately from liquidity injections compared to other assets.
- Yen carry trade unwind / global deleveraging: Short-term bearish but not fundamentally damaging. These events typically resolve within 2–4 weeks. Do not sell at the bottom of a mechanically driven deleveraging cascade.
- Geopolitical crisis (war, sanctions, regime change): Gold outperforms Bitcoin in these scenarios. Bitcoin may spike briefly then retrace. Do not chase the geopolitical spike in Bitcoin price.
Final Takeaway
Bitcoin’s relationship with global economic crises is not simple, but it is not random either. The pattern is consistent once you understand the underlying mechanism: Bitcoin benefits when central banks inject liquidity and suffers when they withdraw it.
Every crisis is different in its surface-level characteristics — a pandemic, a banking failure, an inflation surge, a carry trade unwind. But underneath, the question that determines Bitcoin’s trajectory is always the same: is money supply expanding or contracting?
Your job as an informed Bitcoin holder is not to predict crises. It is to understand what type of crisis is occurring and what the policy response will be — then apply a prepared framework, not an emotional reaction.
Check the Federal Reserve’s liquidity indicators monthly. Know your allocation limits before markets get volatile. Secure your Bitcoin in self-custody. And never make a significant portfolio decision in the first 48 hours of a crisis event.
That framework, applied consistently, is the practical edge that most Bitcoin investors never develop because they are too busy reacting to price charts.
| Disclaimer: This article is educational only and does not constitute financial advice. Bitcoin and other cryptocurrencies are highly volatile and speculative assets. Past performance during specific crisis events does not guarantee future results. Consult a qualified financial advisor before making investment decisions. |
Related Posts

How to Recover Stolen Cryptocurrency

Cryptocurrency Mining with Solar Power