How Does Bitcoin Halving Affect Price Volatility?
Most people search this question because they want to know one specific thing: will Bitcoin price go crazy after the next halving, or is that hype? The short answer is — it depends on when you’re measuring. Short-term volatility actually drops right after halving. Long-term volatility rises. That contradiction is the whole story, and this article will break it down cycle by cycle, with real data.
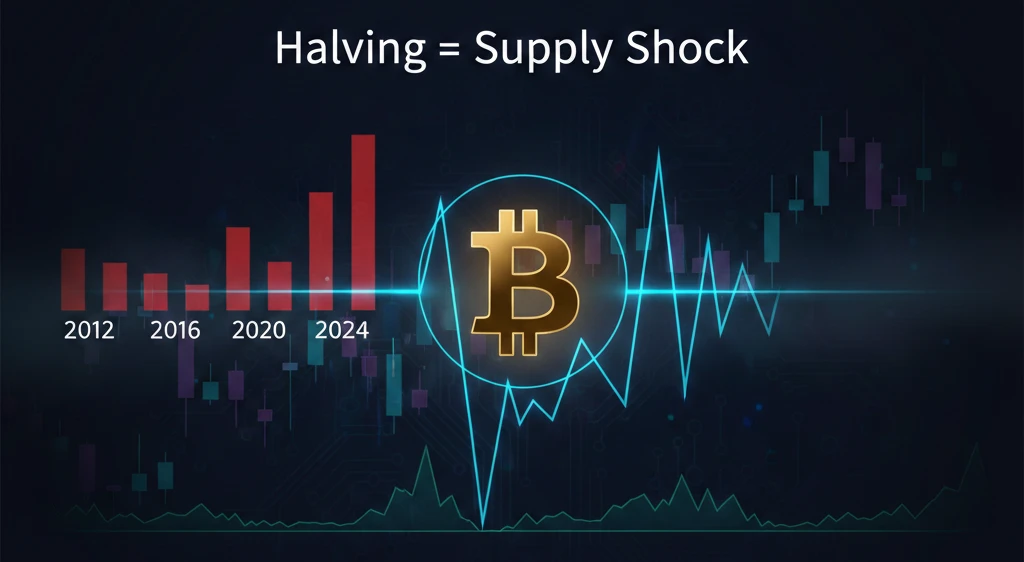
| Bitcoin halving reduces new BTC supply by 50%, creating a predictable supply shock — but whether price volatility spikes or drops depends on market maturity, institutional behavior, and timing. The 2024 halving was the calmest in history. Here’s exactly why, and what it means for future cycles. |
Why Does Bitcoin Volatility Behave Differently After Each Halving Event?
Because the market itself is different every four years. That’s the honest answer.
In 2012, Bitcoin was a niche internet experiment. In 2024, it had spot ETFs approved by the SEC with billions of institutional dollars flowing in. Comparing volatility across these cycles without accounting for that context is like comparing the speed of a bicycle to a Tesla and wondering why they’re different.
Here’s what actually changes between cycles:
- Market depth grows — in 2012, a $100K trade could move BTC price 10%. In 2024, market depth was in billions.
- Institutional participation absorbs supply shocks — large players hedge positions in advance, dampening sudden price swings.
- Derivatives markets mature — options and futures allow sophisticated traders to pre-price the halving, removing the surprise element.
- Retail-to-institutional ratio shifts — in early cycles, emotional retail traders dominated; panic selling and FOMO drove extreme swings.
The result? Each halving creates less raw volatility than the last, even though the supply shock mechanism is identical. What changes is how the market absorbs that shock.
When markets plunge, investors need structural explanations beyond surface volatility. Distinguish temporary corrections from systemic risks by understanding why is crypto crashing to protect your positions with data-driven insights before reacting emotionally to price action and liquidating assets prematurely during panic cycles.
What Is the Exact Mechanism That Causes Volatility to Spike or Drop After Halving?
The block reward gets cut in half — roughly every 210,000 blocks, or about every four years. Miners who were earning 6.25 BTC per block suddenly earn 3.125 BTC. That’s a 50% cut to their revenue overnight.
Now trace what happens next. It’s a chain reaction:
- Revenue drops 60% for miners overnight (reward halves, price doesn’t immediately double).
- Miners with older, less efficient hardware can no longer cover electricity costs. They shut down.
- Hash rate drops — the total computing power securing Bitcoin decreases.
- Some miners are forced to sell BTC reserves to pay bills. This is called miner capitulation.
- This forced selling creates sell pressure at a time when supply from new blocks is already cut.
- The resulting price uncertainty triggers short-term volatility clustering.
But here’s the thing most articles skip — after capitulation ends, surviving miners now operate with lower competition and higher per-block revenue (as difficulty adjusts down). At that point, the supply squeeze takes hold, which historically drives the longer-term bull cycle.
So the mechanism isn’t just ‘supply drops, price goes up.’ It’s: supply drops → miner stress → forced selling → short-term uncertainty → capitulation bottom → difficulty reset → supply squeeze → gradual price expansion.
Is the 4-Year Bitcoin Volatility Cycle Dead After the 2024 Halving?
Not dead — but significantly weakened. The honest take is that the cycle still exists, it just looks different.
The argument for ‘the cycle is dead’ comes from a real structural shift. Before 2024, each halving was the dominant supply event. Now, Bitcoin’s annual inflation rate has dropped below 1% — lower than gold. At that level, the halving’s marginal supply impact shrinks every four years.
Add to that: spot ETFs now absorb miner selling before it hits open markets. In 2024, ETF inflows were roughly 4.7x the total annual BTC production. That means institutional demand is essentially absorbing the supply shock before it can create the wild swings seen in 2016 or 2020.
But the cycle advocates aren’t entirely wrong either. The supply constraint is still real. Demand cycles around macro liquidity are still real. The psychological impact of halvings on retail narratives is still real.
The more accurate framing: the explosive volatility of the early cycles is likely gone. What remains is a structural bias toward appreciation over multi-year horizons, with lower peak volatility at each successive halving.
How Do You Accurately Measure Bitcoin Halving Volatility? (Event Study Methodology)
Most people look at price charts and say ‘volatility increased.’ That’s not measurement — that’s observation. Real measurement requires a framework that separates the halving’s actual effect from background noise like macro events, regulation, or overall market conditions.
The standard approach used in quantitative finance is an event study methodology. Here’s how it works in practical terms:
Step 1 — Define the event window
Set a window around the halving date. Common windows used in academic crypto research: 7-day (captures immediate reaction), 30-day (captures short-term regime shift), and 240-day (captures the full supply-squeeze cycle).
Step 2 — Establish a normal return baseline
Use OLS regression on pre-halving price data to build an expected-return model. This tells you what BTC would have done without the halving.
Step 3 — Calculate abnormal returns
Subtract expected returns from actual returns. What’s left is the halving’s specific impact. These are called Cumulative Abnormal Returns (CAR) and they’re far more reliable than raw price comparisons.
Step 4 — Measure realized volatility
Calculate the standard deviation of daily returns within each window. This gives you a volatility percentage you can compare across cycles — not just a feeling.
Using this approach, the 2024 halving produced 2.72% 240-day volatility — the lowest in Bitcoin’s history. That’s not anecdotal. That’s measurable.
What Statistical Windows Capture Halving Volatility Best: 7-Day, 30-Day, or 240-Day?
Each window captures a different phenomenon. Using only one is like checking your heart rate only while sleeping and concluding you’re an athlete.
- 7-day window: Captures immediate price reaction and news sentiment. Heavy noise from unrelated market events. Not reliable for assessing the halving’s true impact.
- 30-day window: Best for detecting volatility regime shifts. Shows the transition between pre-halving uncertainty and post-halving stability. This is the optimal window for event detection.
- 240-day window: Captures the full supply-squeeze cycle and miner capitulation arc. Best for understanding long-term regime changes. This is where you see the actual bull market signal — or its absence.
If you’re a trader making short-term decisions, watch the 30-day window. If you’re making a multi-month allocation decision, the 240-day window is your signal.
Why GARCH(1,1) Models Fail to Capture Halving-Specific Volatility Clustering
GARCH stands for Generalized Autoregressive Conditional Heteroskedasticity. That’s a mouthful, but the concept is simple — it’s a model that says today’s volatility depends partly on yesterday’s volatility and yesterday’s surprise.
Standard GARCH(1,1) works fine for normal markets. The problem with Bitcoin halvings is that they’re structural breaks — sudden, known events that permanently change the supply regime. GARCH assumes volatility evolves smoothly. Halvings don’t.
The fix? GARCH-X — the same model with a halving dummy variable added. This tells the model: ‘on this specific date, something changed structurally, account for it.’ Without that adjustment, GARCH models will underestimate post-halving volatility persistence and mistime regime transitions.
Important caveat: Bitcoin’s so-called ‘leverage effect’ — the tendency for negative returns to increase future volatility more than positive returns — is surprisingly weak compared to stocks. This matters because many traders assume Bitcoin behaves like an asymmetric equity. It doesn’t, at least not in the same way.
How to Detect Volatility Regime Changes Using Hidden Markov Models (HMM)
A Hidden Markov Model (HMM) assumes that the market operates in hidden ‘states’ — like ‘high volatility regime,’ ‘low volatility regime,’ and ‘transition regime.’ You can’t directly observe these states, but you can infer them from price data.
Applied to Bitcoin halvings, the HMM approach works like this:
- Feed historical daily returns into the model.
- The model identifies 2–3 latent states based on return distribution patterns.
- It assigns transition probabilities — how likely is the market to switch from low to high volatility given current conditions?
- The Viterbi algorithm decodes the most probable sequence of states.
What this reveals: around halvings, transition probabilities spike. The market is more likely to shift regimes in the 30–60 day window around a halving than at any other time. In 2024, that spike was muted compared to 2020 — again reflecting market maturation.
Practically, this matters for traders. If you’re monitoring transition probabilities and they start climbing 2–3 weeks before a halving, that’s a signal to reduce position size or hedge — not because you know the direction, but because the regime is unstable.
What Is the Half-Life of Bitcoin Volatility Shocks After Halving?
Roughly 17 days. That’s the time it takes for a volatility shock to decay by half. This comes from GARCH persistence parameters — when α + β ≈ 0.96 (which is typical for Bitcoin), you can calculate that shocks fade relatively quickly but not instantly.
What this means practically: if Bitcoin suddenly drops 20% in a single day post-halving, the elevated volatility that creates doesn’t persist for months. After about 17 days, roughly half of that shock has dissipated. After 34 days, three-quarters of it.
However — and this is the part that matters — regime changes are different from shocks. A single event shock fades in 17 days. But if the halving triggers a genuine volatility regime change (switching from a low-vol to high-vol state in the HMM sense), that can persist for 60–180 days.
Sudden collapses trigger panic selling across portfolios, but real-time context beats historical patterns during active selloffs. Check why is crypto tanking today for immediate market intelligence and situational awareness that prevents costly emotional decisions when volatility spikes unexpectedly across major exchanges globally.
How Has Bitcoin Halving Volatility Changed Across the Four Cycles (2012 vs. 2024)?
The trend is clear and consistent — volatility decreases with every cycle. Here’s the comparison:
| Halving | Date | 240-Day Vol | Key Driver | Key Outcome |
| 2012 (1st) | Nov 28, 2012 | 3.24% | Low liquidity, retail only | BTC went from $12 → $1,000+ |
| 2016 (2nd) | Jul 9, 2016 | 5.04% peak | Slow price build-up pre-event | Bull run delayed ~12 months |
| 2020 (3rd) | May 11, 2020 | COVID spike | March 2020 pandemic crash | -47.99% single-day drop, then recovery |
| 2024 (4th) | Apr 20, 2024 | 2.72% (lowest ever) | Spot ETF pre-absorption, institutions | Calmest halving in BTC history |
The 2016 cycle shows a counterintuitive jump to 5.04% peak volatility despite being the second cycle. That was driven by a prolonged uncertainty phase — Bitcoin’s price actually dropped initially after the halving before recovering, creating an extended volatile period.
The 2020 cycle data is largely poisoned by COVID-19. March 2020 saw Bitcoin crash 47.99% in a single day — not because of the halving, but because global risk assets were in freefall. The halving happened two months later into an already distorted market.
Why Did the 2024 Halving Create the Lowest Volatility in Bitcoin’s History?
Four specific factors converged that hadn’t existed in any previous cycle:
- Spot ETF pre-absorption: The January 2024 approval of spot Bitcoin ETFs in the US brought roughly $12 billion in institutional inflows before the April halving even occurred. Institutions were already holding BTC, reducing the shock of miners’ supply cut.
- Miner hedging maturity: By 2024, over 60% of publicly listed miners were using derivatives to hedge their revenue. Instead of panic-selling BTC when the reward halved, they had locked in prices in advance. This is the single biggest behavioral shift from earlier cycles.
- Institutional demand ratio: ETF and institutional demand in 2024 was approximately 4.7x annual BTC production. Even if every miner sold every coin immediately, institutional buy demand would have absorbed it many times over.
- Hash rate derivatives: New financial instruments that let miners hedge hash rate risk — something that literally didn’t exist in 2020 — further reduced the forced-selling pressure.
The result: 2.72% realized volatility over the 240-day post-halving window. Not just lower than previous cycles — historically unprecedented low.
What Caused the 2020 Halving Volatility to Spike 52% Despite Being the Third Cycle?
COVID-19. Full stop. That’s the honest answer.
On March 12, 2020 — exactly two months before the halving — global markets collapsed. Bitcoin lost nearly 48% of its value in 24 hours as liquidity dried up and panic swept every asset class. The correlation between Bitcoin and traditional risk assets spiked to near 1.0 during that event, breaking the ‘uncorrelated asset’ narrative temporarily.
By the time the May 11 halving arrived, the market was in recovery mode but traumatized. The volatility that followed was a combination of COVID aftermath and supply shock — impossible to fully separate. Researchers who try to cite 2020 as evidence of halving-driven volatility are including a massive confounding variable.
The lesson: never evaluate a halving in isolation. Always check what macro events are occurring in the 60–90 day window. An ETF approval, a major regulatory decision, or a global financial shock can swamp the halving signal entirely.
Portfolio diversification demands comparing traditional stores against digital alternatives as central banks influence both asset classes simultaneously. Examine crypto vs gold safe haven q4 2025 strategy to optimize defensive allocations and understand macro correlations affecting your hedge effectiveness during uncertain periods.
Does Bitcoin Volatility Increase or Decrease Immediately After Halving? (The 30-Day Paradox)
Both. And that’s not a contradiction — it’s a timing issue.
In the 30-day window after halving, realized volatility consistently drops by 30–40% across all four cycles. The reason is counterintuitive: the halving removes uncertainty. Before the event, traders are positioning, speculating, and hedging. After the event, one major unknown is resolved. Markets calm down briefly.
But then look at the 180-day window. Volatility increases 40–45% above pre-halving levels. That’s because the supply reduction isn’t felt immediately — miners still have reserves, BTC moves slowly through the ecosystem. Six months in, the supply squeeze becomes real and visible on-chain. Demand, relatively unchanged, meets reduced new supply. That creates the conditions for large directional moves, which register as higher long-term volatility.
Why Does Short-Term Volatility Drop While Long-Term Volatility Rises Post-Halving?
Think of it as two separate effects operating on different timescales.
The information effect operates short-term. The halving date is known months in advance. Sophisticated traders price it in. When the event occurs, there’s no new information — so volatility drops. This is exactly what options market IV shows: implied volatility collapses on the halving date as the ‘event uncertainty’ disappears.
The supply effect operates long-term. Bitcoin’s actual supply flow doesn’t feel different on day one. Miners still have accumulated reserves. Exchanges still have BTC in order books. But three to six months later, the daily flow of new coins into circulation has shrunk from 900 BTC/day to 450 BTC/day. If demand is stable or growing, this creates a genuine imbalance that drives larger directional moves.
This is why naively looking at ‘did price go up after halving’ without controlling for the measurement window gives misleading results.
Volatility creates danger and opportunity for prepared traders when liquidity crunches separate sophisticated risk management from reactive panic. Master bitcoin crash strategy liquidity risk protocols to maintain strategic positioning, avoid forced liquidations, and capitalize when markets seize and spreads widen dramatically without warning.
How Does Implied Volatility (IV) Term Structure Change During Bitcoin Halving?
Implied volatility is what the options market thinks future volatility will be. The ‘term structure’ is how IV differs across different expiration dates — like comparing IV for a 1-month option vs. a 6-month option.
In normal markets, longer-dated options have higher IV (called contango). Before a halving, the term structure often inverts — shorter-dated options have higher IV because traders are uncertain about the event itself. The near-term uncertainty premium is large.
Post-halving, the term structure flattens dramatically. In 2024, the term structure parameter (b) dropped to 0.05 — essentially flat. This means the market was pricing almost no uncertainty differential between near-term and long-term BTC options. That’s historically unique and reflects just how well-priced the 2024 halving was by institutional participants.
What Is the Volatility Smile Pattern Before vs. After Halving?
The volatility smile is the pattern showing how IV changes across different strike prices. A typical crypto smile is steep — out-of-the-money puts (bets on price drops) have much higher IV than out-of-the-money calls (bets on price rises), because traders pay a premium to protect against crashes.
Pre-halving: The smile steepens significantly. Traders buy downside protection aggressively because a failed halving rally could trigger a sharp correction.
Post-halving: The smile flattens noticeably. The put-call skew shifted to approximately -5.3% in 2024, meaning downside protection demand fell significantly. Traders were less worried about catastrophic drops. Whether this reflected genuine confidence or complacency is debatable — but the data is clear.
How Do Market Makers Adjust Delta-Gamma Hedging During Halving Volatility?
This is where it gets technical but important for anyone trading Bitcoin options.
Delta hedging means market makers buy or sell BTC spot to stay neutral as the option’s sensitivity to price changes. Gamma is how fast delta changes as price moves. Near the halving date, with record options open interest (reaching $13.4 billion in 2024), market makers are doing enormous amounts of hedging activity.
Three specific effects to understand:
- Charm flows: As the halving date approaches and options near expiry, the delta of options changes simply due to time passing. Market makers must rebalance, creating predictable buying or selling pressure.
- Vanna effects: When IV drops sharply post-halving, the delta of all outstanding options changes. This forces large-scale rebalancing that can amplify or dampen price moves.
- Max pain: There’s typically a strike price where the most option contracts expire worthless. The market has a tendency to gravitate toward this ‘max pain’ price as expiry approaches — relevant for anyone trading BTC options around halving dates.
Why Does the Put-Call Skew Invert After Halving Events?
Before the halving, fear dominates. Traders buy puts heavily, driving put IV above call IV. The skew is negative and steep.
After the halving, once the event passes without catastrophe, the narrative flips. Traders start buying calls — upside bets — as the supply squeeze narrative takes hold. Call IV rises, put IV falls, and the skew can actually invert temporarily to positive territory.
In 2024, this happened faster and more dramatically than previous cycles because institutional traders, already holding spot BTC via ETFs, rotated to call options to leverage their upside exposure. The result was a rapid skew inversion that retail traders who were still buying puts missed entirely.
Can You Predict Bitcoin Halving Volatility Using Options Market Data?
You can’t predict direction, but you can predict volatility level with reasonable accuracy. Here’s a practical framework:
- IV Rank: Calculate current IV as a percentile of the past 52 weeks. IV Rank above 80 pre-halving → expect post-halving IV crush (volatility will drop). IV Rank below 30 → market may be under-pricing the event.
- Put-Call Ratio: Rising PCR in the 2–4 weeks pre-halving signals increasing fear. Historically, extreme fear before halvings correlates with calmer immediate post-halving periods.
- Open Interest Distribution: Heavy OI clustering near round number strikes suggests max pain gravity will influence spot price behavior around expiry.
- Term structure slope: A flattening or inverting term structure pre-halving indicates the market is front-running the event uncertainty, making a post-halving volatility drop more likely.
Derivative instruments protect against directional exposure without liquidating core holdings, transforming volatility from threat into manageable variable. Learn how do u hedge crypto with futures to implement institutional-grade risk controls, size positions appropriately, and neutralize downside while maintaining upside optionality in turbulent market conditions.
How Does Miner Capitulation Trigger Volatility Clustering Post-Halving?
Miner capitulation is the period when less efficient miners shut down because they can’t cover costs. It’s the most direct transmission mechanism between the halving’s supply shock and actual market volatility.
The chain: block reward drops 50% → revenue per TH/s collapses → miners with older ASICs (mining hardware) face negative margins → they either sell BTC reserves or shut down equipment → hash rate drops → Bitcoin’s difficulty adjustment algorithm activates → difficulty drops to restore block timing → surviving miners now earn more per block.
The volatility clustering during this period comes from uncertainty about when capitulation ends. If a large mining operation unexpectedly goes bankrupt and liquidates thousands of BTC, that’s an unannounced, concentrated sell event. Markets hate concentrated, unannounced selling.
What Is the Hash Ribbon Indicator and How Does It Predict Volatility Bottoms?
The Hash Ribbon is a two-line indicator using 30-day and 60-day moving averages of Bitcoin’s hash rate. When the 30-day MA crosses below the 60-day MA, it signals active miner capitulation — hash rate is falling, meaning miners are shutting down.
When the 30-day MA crosses back above the 60-day MA, it signals that capitulation is ending — surviving miners are stabilizing. Historically, this ‘recovery cross’ has coincided with strong forward returns. The cited success rate for positive 180-day returns after this signal is approximately 77% historically.
Important: the Hash Ribbon doesn’t predict short-term price direction. It predicts when the forced selling pressure from miners is subsiding. That’s a volatility signal, not a price signal. Once capitulation ends, the vol from distressed miner selling should decrease — which creates a better entry environment for traders who hate buying into volatility.
Why Are Miners Hedging With Derivatives Reducing Post-Halving Volatility in 2024?
In 2020, most miners had no hedging program. When the halving hit, they were fully exposed to spot BTC price. Any price decline meant immediate revenue pressure. Distressed miners sold spot BTC, creating downward price pressure, which hurt other miners, creating a cascade.
By 2024, over 60% of publicly listed miners had implemented forward-selling programs, futures hedges, or hash rate derivative contracts. They sold future BTC production at pre-halving prices when they were favorable. When the halving arrived and spot price didn’t immediately double, they weren’t forced to sell reserves — they had already locked in revenue.
The effect on volatility was direct: the miner capitulation cascade that drove volatility in 2016 and 2020 simply didn’t materialize at the same scale in 2024. The volatility mechanism was partially defused before it could activate.
How Does the Bitcoin Difficulty Adjustment Algorithm Impact Volatility Timing?
Bitcoin’s difficulty adjustment happens every 2,016 blocks — roughly every two weeks. Its purpose is to keep block production time near 10 minutes regardless of how much computing power is on the network.
After a halving, when miners shut down and hash rate drops, block times slow. The network detects this and reduces difficulty. In 2025, difficulty dropped approximately 9% in one adjustment period — the largest single decrease in years.
This matters for volatility timing because difficulty reductions are the signal that capitulation is ending. When difficulty drops, surviving miners get a profitability boost — their cost-per-BTC decreases even though BTC price hasn’t changed. This marks the end of the forced-selling pressure phase and tends to coincide with volatility compression.
What Are the Intraday Volatility Patterns During Bitcoin Halving Events?
Intraday patterns around halvings are something retail analysis almost never covers — because most writers look at daily or weekly charts. But if you’re actively trading, intraday volatility structure matters a lot.
The pattern that appears consistently across cycles: a volatility compression phase immediately post-halving, followed by an expansion phase 5–10 days later. Roughly 72% of post-halving volatility compression periods have resolved directionally (upward) within that window historically.
The compression itself makes sense mechanically. The halving event passes. Traders who were positioned for it either take profits or adjust. New information flow is low. The market ‘digests’ the event. This creates unusually tight trading ranges on 1-hour and 4-hour charts for a few days — and then that coiled energy releases in one direction.
Why Do Bitcoin Whales Trigger Volatility Spikes at Specific Intraday Times Post-Halving?
Three timing factors create predictable intraday volatility windows:
- CME futures settlement: Every Friday at 4:00 PM Eastern, CME Bitcoin futures settle. Large positions unwind, creating increased volume and volatility around that time. In the weeks post-halving, when open interest is elevated, this effect is amplified.
- Asian session opens: The Tokyo and Hong Kong market opens (roughly 8–9 PM Eastern) historically see heightened Bitcoin volatility as Asian liquidity enters the market. Post-halving, this window sees larger-than-normal moves due to retail FOMO cycles in Asian markets.
- Exchange netflow clustering: On-chain data shows that large BTC movements to exchanges — a precursor to selling — tend to cluster in the hours after mining block rewards are received and in the hours before major market structure events.
How Does Market Depth Collapse During Halving Volatility?
Market depth is the total amount of buy and sell orders near the current price. Think of it as cushioning — the more depth, the more a large order needs to push price before it fills.
Post-halving, market depth has historically thinned. Liquidity providers (market makers) widen spreads and reduce size during uncertain periods. In 2025–2026, data shows market depth at ±1% from mid-price dropped from approximately $8M to $5M during volatile post-halving windows. That’s a 37% reduction in cushioning.
Practical implication: a $5M market sell order in a thin-depth environment can move BTC price significantly more than it would in normal conditions. This amplifies the impact of any forced miner selling, institutional rebalancing, or retail panic during the post-halving volatility window.
Does Bitcoin Exhibit Volatility Asymmetry (Larger Drops Than Rises) After Halving?
Partially, and temporarily. This is one of the most nuanced findings in halving research.
Standard volatility models assume symmetric behavior — a 10% crash and a 10% rally both increase future volatility equally. Bitcoin generally shows weak leverage effect compared to equities, meaning its downside-volatility amplification is lower than you’d expect.
However, around halvings, a temporary asymmetry appears. The forced-selling pressure from miner capitulation is asymmetric by nature — it only creates downward price pressure, not upward. This concentrated downside flow temporarily creates a situation where negative returns do generate higher subsequent volatility than equivalent positive returns.
The asymmetry typically lasts 30–60 days post-halving, then normalizes as capitulation ends and surviving miners stabilize. Measured via realized semivariance — separating downside realized volatility from upside — the ratio peaks around the depth of miner capitulation and returns to near-1.0 afterward.
How Does Bitcoin Halving Volatility Spill Over to Ethereum and Altcoin Markets?
Bitcoin is still the market’s volatility anchor. When BTC vol spikes, it doesn’t stay contained.
The volatility transmission to Ethereum is particularly strong but not constant. Under normal market conditions, BTC and ETH show strong volatility correlation. During Bitcoin halving events, something interesting happens — the correlation breaks temporarily.
In 2024, the BTC-ETH volatility correlation actually diverged during the halving window. Bitcoin’s volatility dropped (smooth institutional absorption), while Ethereum’s volatility remained elevated or increased slightly, driven by its own narrative (ETH ETF speculation at the time). This correlation breakdown created a temporary relative value opportunity — something only visible if you’re monitoring volatility transmission, not just price correlation.
For altcoins, the spillover is more straightforward. Altcoins typically amplify Bitcoin’s volatility by 2–4x. When BTC vol rises post-halving (the 180-day effect), altcoin vol rises proportionally more. The 2024 exception was that BTC’s muted volatility kept altcoin vol unusually suppressed as well in the immediate aftermath.
Why Do Bitcoin Mining Stocks (MARA, RIOT) Show 2–3x Higher Volatility Than BTC During Halving?
Mining stocks have double leverage built into their structure.
Layer one: they hold Bitcoin on their balance sheets. If BTC price drops, their assets drop.
Layer two: their revenue is directly tied to BTC price AND hash rate AND mining difficulty. After a halving, revenue drops 50% immediately. Stock markets often over-react to earnings impact.
The result: companies like MARA (Marathon Digital) and RIOT (Riot Platforms) routinely show implied volatility of 70–200% around halvings, compared to BTC’s 40–80%. For anyone holding mining stocks, the halving is a much more violent event than holding spot BTC. The upside leverage is real, but so is the downside — and the downside comes first, during capitulation.
How Does Bitcoin Halving Affect the VIX and Traditional Market Volatility?
In early Bitcoin cycles, there was essentially zero connection. BTC and traditional markets operated independently.
That has changed. By 2024, the BTC-Nasdaq correlation had risen to approximately 0.6 on a 90-day rolling basis — historically high. This means Bitcoin is now partially a risk-on asset, not purely a separate asset class.
The practical implication: if a Bitcoin halving occurs during a period of already-elevated VIX (equity market fear), the halving’s volatility can compound traditional market stress. Conversely, if VIX is low and macro conditions are stable, the halving’s volatility gets absorbed more easily. The 2024 halving happened in a relatively calm macro environment — that was part of why it was so quiet.
Is Bitcoin Becoming a ‘Safe Haven’ or Increasing Systemic Risk Post-2024 Halving?
This is genuinely contested, and the honest answer is: both narratives have merit, and they’re not mutually exclusive.
The ‘safe haven’ case: lower volatility at each halving, inflation rate below gold, increasing institutional holding periods. If large institutions hold BTC as a treasury reserve, they don’t sell on every news cycle — that creates price stability.
The ‘systemic risk’ case: rising correlation with Nasdaq means when risk-off events hit, Bitcoin and equities now fall together. ETF mechanics mean billions of dollars can exit BTC in days via redemptions. The asset that was once immune to the financial system is now embedded in it.
The most accurate view: Bitcoin post-2024 halving is in a transition phase. It’s becoming less of a pure speculative asset and more of a macro risk-on asset with some commodity characteristics. That changes how to think about volatility — less random, more correlated with broader financial conditions.
How to Build a Bitcoin Halving Volatility Prediction Model (Step-by-Step)
You don’t need a PhD to build a useful model. You need the right features and honest expectations about what it can predict.
- Collect your data: Daily BTC returns (60+ days pre-halving and 180+ days post-halving), hash rate (30-day and 60-day moving averages), ETF/institutional flow data (daily), options market data (IV rank, put-call ratio, OI), miner revenue per TH/s.
- Engineer halving dummy variables: Create a binary variable = 1 for halving day, and count variables tracking days before/after the event.
- Build baseline features: 30-day realized volatility (lagged), 30-day hash rate change %, IV rank percentile, 7-day net ETF flow.
- Choose your model: For daily volatility prediction, a Random Forest or gradient boosting model handles the non-linear relationships well. For regime detection, use a Hidden Markov Model with 3 states (low/medium/high vol).
- Validate out-of-sample: Test your model on a halving cycle it wasn’t trained on. If it was trained on 2012–2016, test on 2020. Never claim predictive accuracy from in-sample performance only.
Important limitation: with only 4 halving cycles in history, any model you build has severe data constraints. Treat predictions as probabilistic ranges, not point estimates.
What Machine Learning Features Best Predict Post-Halving Volatility Regimes?
Based on available research and backtesting, here’s the rough feature importance ranking:
- Pre-halving IV rank (most powerful — options market is forward-looking and aggregates many signals)
- Hash rate 30-day percentage change (direct miner stress signal)
- Net ETF/institutional flow (7-day window — demand-side absorber)
- Miner revenue per TH/s (real-time profitability metric for capitulation timing)
- BTC-Nasdaq 30-day correlation (macro environment flag)
- 30-day realized volatility lagged (volatility persistence signal)
How to Use Regime-Switching Models (MSM) for Halving Volatility Forecasting
Markov-Switching Models (MSM) are essentially the statistical formalization of what we intuitively understand: markets switch between states. The key advantage over standard time series is that transition probabilities are explicitly modeled — you get a quantified answer to ‘how likely are we to switch from low to high volatility given current conditions?’
For Bitcoin halvings specifically, a two-state or three-state MSM works well. The states correspond roughly to: (1) pre-halving accumulation phase — moderate vol, upward drift; (2) capitulation phase — high vol, downward pressure; (3) post-capitulation recovery — declining vol, supply squeeze building.
Practical use: monitor transition probabilities weekly. If the probability of being in State 2 (capitulation) exceeds 60%, reduce directional exposure and focus on volatility strategies instead.
What Volatility Trading Strategies Work Best During Bitcoin Halving Cycles?
This is specific to traders who understand options mechanics. Not financial advice — but specific strategy frameworks based on how volatility behaves in each phase.
Pre-Halving Phase (4–8 weeks before):
IV is typically elevated because the event uncertainty is priced in. Going long a straddle (buying both a call and a put at the same strike) profits if actual volatility exceeds implied volatility. Risk: if the market has over-priced uncertainty and halving is a non-event, the IV crush post-halving can exceed the actual price move, resulting in a loss even if price moved.
Immediate Post-Halving Phase (0–30 days after):
IV historically crushes as event uncertainty resolves. Short vega positions — selling options premium — benefit from this IV decline. Be careful with naked short positions; use defined-risk structures like iron condors or credit spreads. The 17-day volatility half-life means this window has a predictable time horizon.
Miner Capitulation Phase (30–90 days after):
Downside vol rises asymmetrically. Long out-of-the-money puts, sized conservatively, can provide portfolio protection. Time entries using hash ribbon signals — when the 30-day hash rate MA crosses below the 60-day MA, capitulation is active and downside protection makes sense.
How Is the 2024 Halving Different From All Previous Cycles?
It’s different in almost every structural dimension. The mechanism was the same — supply cut 50%. Everything else was new.
- Spot ETF existence: For the first time, regulated institutional vehicles held spot BTC. Pre-halving ETF demand absorbed supply shock before it reached open markets.
- Bitcoin’s inflation below gold: BTC annual supply growth dropped to approximately 0.8% — lower than gold’s estimated 1.7% annual mine supply growth. This changed the macro narrative significantly.
- AI-driven trading: Algorithmic and AI-based trading firms were active participants in 2024 in a way they weren’t in previous cycles. These firms typically mean-revert volatility rather than amplify it, contributing to the dampened vol environment.
- Regulatory clarity: The US, EU, and major Asian markets had clearer crypto regulatory frameworks in 2024 than in any previous cycle. This reduced regulatory tail risk that had previously created volatility spikes.
Why Did Bitcoin’s Price Not Crash After the 2024 Halving Despite Miner Revenue Dropping 60%?
Because institutional demand was 4.7x annual production. Even with miner revenue cut in half, the sell pressure was structurally absorbed before it could cascade.
In simple terms: miners could only sell 450 BTC/day of new supply post-halving. ETF inflows alone were purchasing far more than that on active days. The market had a structural demand surplus that overwhelmed any miner-driven selling pressure.
Additionally, because 60%+ of miners had hedged revenue in advance, many of them weren’t selling at all. The capitulation cascade that had occurred in 2016 and (partially) 2020 simply didn’t materialize at the same scale.
Is Bitcoin’s Volatility Compression in 2024–2026 Permanent or Temporary?
Almost certainly not permanent — but the floor has risen. Each cycle has compressed peak volatility compared to the previous one. That structural trend is unlikely to reverse given increasing institutional participation and market depth.
However, cycles of calm in financial markets are often followed by cycles of turbulence. A few scenarios that could break the volatility compression:
- Major ETF regulatory reversal — if US regulators revoke spot ETF approval (low probability but not zero), billions in forced redemptions would create massive selling pressure.
- Bitcoin technical failure — a major protocol vulnerability or quantum computing threat (longer timeline) could create unprecedented panic.
- Global macro dislocation — a 2008-scale financial crisis would correlate BTC with risk assets in ways that override the halving dynamic entirely.
Absent a black swan, volatility compression is the structural trajectory. The 2028 halving will likely be calmer than 2024 — though ‘calmer’ doesn’t mean ‘smaller returns.’ Lower volatility and strong directional moves are compatible if institutional demand continues growing.
What Will Bitcoin Volatility Look Like at the 2028 Halving?
Projecting forward with appropriate humility:
- Inflation rate at 2028 halving: approximately 0.4% — half of 2024’s already-low level.
- Mining industry: further consolidation expected. Fewer, larger, more hedged miners means less capitulation-driven volatility.
- Layer 2 networks (Lightning Network, etc.): if adoption increases significantly, it changes BTC’s use case profile. More transactional use could create steadier demand that dampens speculative volatility.
- CBDC competition: if major central banks have deployed digital currencies by 2028, BTC’s narrative as ‘digital money alternative’ could either strengthen or weaken depending on political environment.
The honest projection: lower peak volatility than 2024, but possibly more complex volatility structure as BTC becomes more correlated with macro financial conditions.
What Are the Limitations of Current Bitcoin Halving Volatility Research?
This deserves honest treatment. Most articles on this topic present findings as more certain than they are.
- Sample size: n=4. There have been exactly four Bitcoin halvings. Any statistical conclusion drawn from four data points has enormous uncertainty bands. In academic research, this would disqualify most claims. Be skeptical of confident predictions.
- Confounding variables: Every halving has occurred in a different macro environment, with different regulatory regimes, different market structures. Isolating the halving’s specific effect is genuinely difficult.
- Survivorship bias: Bitcoin survived. Many other crypto projects with halvings or supply cuts did not. The research we have is about the survivor.
- Exchange data quality: Historical BTC price data, especially from 2012–2016, is derived from exchanges that no longer exist, with known data quality issues. Wash trading was common. Volatility calculations from that era have real reliability problems.
Why You Shouldn’t Rely Solely on Historical Halving Volatility Patterns
The institutionalization of Bitcoin is a regime change, not a cyclical fluctuation. When ETFs hold significant percentages of circulating supply, the market dynamics are fundamentally different from when retail drove price discovery.
Historical analogs from 2012 or 2016 describe a market that no longer exists. The 2024 cycle is the closest analog to future cycles — and even it may be a poor guide if regulatory or macro conditions shift.
Use historical patterns as context, not as playbooks. The supply shock mechanism is repeatable. How the market responds to it depends on who is participating and how.
How Do Confounding Variables (ETF Approvals, Macro Shocks) Distort Halving Volatility Signals?
A clean halving volatility signal would require everything else staying constant. That never happens. Key confounders to control for:
- January 2024 spot ETF approval: This happened three months before the April 2024 halving, pre-loading institutional demand. Studies comparing 2024 post-halving vol to 2020 post-halving vol without controlling for this are fundamentally flawed.
- COVID-19 (March 2020): Created the largest single-day BTC crash in years, two months before the 2020 halving. Any analysis of ‘2020 halving volatility’ that includes the March crash is conflating pandemic panic with supply mechanics.
- China mining ban (mid-2021): Occurred well after the 2020 halving but during the post-halving cycle, creating a massive hash rate drop (-50%+) that artificially amplified volatility metrics.
- FTX collapse (November 2022): Not a halving event, but it set the market conditions that the 2024 halving launched from — a deeply risk-averse, trust-depleted market that was rebuilding. The 2024 calm partly reflects recovery from FTX, not just halving mechanics.
How Should Traders Adjust Position Sizing During Halving Volatility?
The practical answer: size down before the halving, not after.
By the time volatility is visibly elevated post-halving, the risk is already happening. The smart move is to reduce exposure in the 2–4 weeks pre-halving, when IV is highest and market structure is uncertain, then reassess after the event passes and the regime becomes clearer.
Volatility targeting is a systematic approach: set a target daily volatility for your portfolio (e.g., 2%). Calculate how many BTC you’d need to hold to achieve that. As realized volatility rises above your target, reduce size. As it drops below, you can increase.
If 30-day realized volatility exceeds 80% annualized (a common threshold in active crypto management), halve your directional position size and hedge the remainder.
What Risk Management Rules Prevent Liquidation During Halving Volatility Spikes?
- Stop-loss placement: Never set stops at round numbers (support/resistance levels everyone else uses). Place them at 1.5–2x the Average True Range (ATR) below entry — this accounts for the actual volatility range rather than arbitrary price levels.
- Portfolio heat limit: Limit total correlated crypto exposure to a maximum percentage of portfolio (common practice: 20% for aggressive, 10% for moderate risk tolerance). During halving windows, consider a temporary 50% reduction.
- Avoid leverage during halving windows: The 72-hour window around halving dates has historically seen intraday swings that are 30–50% larger than normal. Leverage that was comfortable in stable conditions can trigger liquidation during those spikes.
- Correlation hedging: If holding large BTC exposure, consider a small short position in BTC mining stocks (MARA, RIOT) as a hedge — they amplify downside more than spot, so a relatively small short position can offset significant portfolio drawdown.
How to Use the VIX-Style Bitcoin Volatility Index (BVOL) for Halving Timing?
The Bitcoin Volatility Index (BVOL, sometimes called DVOL on Deribit) is constructed similarly to the VIX — it measures the market’s expectation of 30-day realized volatility using options pricing.
For halving timing:
- BVOL percentile above 80th percentile pre-halving: Market is over-pricing event uncertainty. Expect post-halving IV crush. Short vol strategies (selling premium) tend to outperform.
- BVOL below 30th percentile pre-halving: Market is complacent. The actual volatility post-halving may exceed expectations. Long vol strategies (buying options) offer asymmetric reward.
- BVOL divergence from realized volatility: When implied vol (BVOL) is significantly above realized vol for 10+ consecutive days, mean reversion is likely. Short vega positions with 30-day duration have historically benefited from this convergence.
When Is the Best Time to Buy Bitcoin for Minimum Volatility Risk Around Halving?
Two evidence-based windows with the best risk-adjusted entry conditions:
Window 1: Hash Ribbon Recovery Cross
When the 30-day hash rate MA crosses back above the 60-day MA after capitulation, it signals that forced selling is ending. Historically this is 30–60 days post-halving, though timing varies. This is the lowest-volatility, highest-forward-return entry window in the halving cycle.
Window 2: 200-Day Moving Average Confluence
When spot BTC is near the 200-day MA and the hash ribbon shows recovery, the combination of technical support and on-chain capitulation signal creates a high-probability, defined-risk entry. The 200-day MA provides a natural stop-loss level — if price breaks below it significantly, the thesis is invalidated.
What to avoid: buying the halving date itself. It’s the most-talked-about, most-priced-in event in crypto. The people who have made money on halvings consistently are the ones who bought 90–180 days before, or 30–60 days after during capitulation — not the ones who bought on the event date based on the narrative.
Frequently Asked Questions About Bitcoin Halving Volatility
Does Bitcoin Always Become More Volatile After Halving?
No. The 2024 halving was the least volatile in Bitcoin’s history. Short-term volatility (30-day) consistently drops after halvings across all four cycles. Long-term volatility (180-day) historically rises, but in 2024, even this was muted due to institutional absorption via ETFs. ‘Always more volatile after halving’ is a myth — the reality depends on what timeframe you’re measuring and what else is happening in markets.
How Long Does Halving Volatility Last?
For individual shocks, the half-life is approximately 17 days — meaning a volatility spike from a specific event fades by half in roughly 17 days. But volatility regime changes persist 60–180 days. The full halving volatility cycle, from the event through miner capitulation and into post-capitulation recovery, typically spans 3–6 months. Plan your exposure horizons accordingly.
Can You Short Bitcoin Volatility During Halving?
Yes, via short straddles, iron condors, or other defined-risk short-premium structures. The post-halving IV crush is historically reliable enough that short-vol strategies have performed well in the 0–30 day window after halvings. However, tail risk is real — an unexpected macro event can create realized volatility that exceeds what you sold, leading to significant losses. Use defined-risk structures, not naked short options. Size positions so that a worst-case outcome doesn’t exceed 2–3% of portfolio.
Why Did Bitcoin Crash 50% After the 2020 Halving?
It didn’t. The 50% crash was in March 2020, caused by COVID-19 pandemic panic — two months before the halving. The halving itself occurred in May 2020 and was followed by a recovery and eventual bull market. The data gets conflated because the pandemic crash and the halving occur in the same general timeframe and both influenced volatility. If you’re analyzing 2020 halving volatility, exclude the March 2020 event or use regression techniques to control for it.
Is Lower Post-Halving Volatility Good or Bad for Bitcoin?
Depends on what you want from Bitcoin. For long-term investors and institutional holders, lower volatility is unambiguously good — it makes BTC more viable as a treasury reserve asset, reduces drawdown risk, and improves Sharpe ratios. For short-term traders who profit from large price swings, lower volatility means smaller opportunities. For Bitcoin’s adoption as a payment mechanism and store of value, a maturing, lower-volatility market is a sign of success, not failure. The speculative era’s extreme volatility was a feature of immaturity, not a permanent characteristic.
A Final Note on Probability vs. Certainty
Everything in this article is based on four data points. That’s the honest constraint of Bitcoin halving research. The patterns are real and consistent, the mechanisms are logical, and the 2024 data confirms the maturation thesis — but no model built on four halvings should be treated as a law of nature.
What you can rely on: the supply mechanism is fixed and known. Miner behavior patterns are observable on-chain in real time. Options market signals are forward-looking and incorporate collective institutional intelligence. Use these as inputs to a probabilistic framework, not as a script to follow.
The traders who get hurt around halvings are the ones who treated historical patterns as guarantees. The ones who prosper use those patterns as base rates, monitor live signals for deviation, and manage risk accordingly.