How Does Fear and Market Sentiment Influence Bitcoin Declines?
Bitcoin does not fall in a straight line. It crashes in waves — and almost every wave starts with fear. Not the price drop itself, but the emotion that comes before it, spreads through social media, gets amplified by leverage, and turns a normal correction into a full-scale collapse.
This article explains exactly how that process works, from the psychological triggers to the on-chain mechanics to the cross-market contagion. If you want to understand why Bitcoin drops hard and fast during fear events, this is where you get that answer.
Why Does Bitcoin Crash When Fear Spikes? The Brain and Biology Behind Panic Selling
To understand why Bitcoin crashes during fear, you first need to understand what fear does to a human brain making financial decisions.
When you see Bitcoin drop 10% in an hour, your brain releases cortisol — the stress hormone. Cortisol is designed for survival. It pushes you to act fast, avoid danger, and conserve resources. In real life, that is helpful. In trading, it is dangerous. Cortisol narrows your focus to the immediate threat (more losses) and shuts down rational thinking about probabilities and long-term outcomes.
At the same time, dopamine — the reward chemical — starts dropping. You have been receiving dopamine hits every time Bitcoin went up. When the price falls, dopamine withdrawal creates anxiety. That anxiety feels like the market telling you to get out.
Then there is loss aversion. Behavioral economists — specifically Daniel Kahneman and Amos Tversky — proved that losing $1,000 feels roughly 2.5 times more painful than gaining $1,000 feels good. This is not a choice. It is hardwired into human psychology. When Bitcoin drops, the pain of losses is disproportionately amplified, which means people make disproportionately extreme decisions — like selling their entire position at the worst possible moment.
What this means in practice: When Bitcoin drops 20%, most retail holders feel 50% worth of emotional pain. That gap between actual loss and emotional response is what drives panic selling, which then causes more selling, which then causes more pain in others. This is the fear cascade.
What to do: Recognize cortisol-driven thinking. If you feel the urge to sell everything in a panic, wait 30 minutes before acting. Ask: “Am I making this decision based on price action and analysis, or based on the fear I feel right now?”
What NOT to do: Do not make irreversible sell decisions during rapid drops without confirming the move against at least one objective metric — like volume, on-chain data, or the Bitcoin Fear & Greed Index readingWhen evaluating digital assets for your portfolio, it’s essential to understand that not all cryptocurrencies serve the same purpose. While Bitcoin was originally designed as a digital alternative to traditional currency—a decentralized store of value independent of governments and banks—Ethereum functions as a programmable platform for smart contracts and decentralized applications. This fundamental distinction means Bitcoin primarily acts as “digital gold” for value preservation, whereas Ethereum enables developers to build complex financial services, NFTs, and DeFi protocols. Understanding the difference between Bitcoin and Ethereum helps investors make informed decisions about which asset aligns with their investment goals, whether they’re seeking long-term value storage or exposure to blockchain technology innovation.
.
What Is the Bitcoin Fear & Greed Index and How Does It Actually Work?
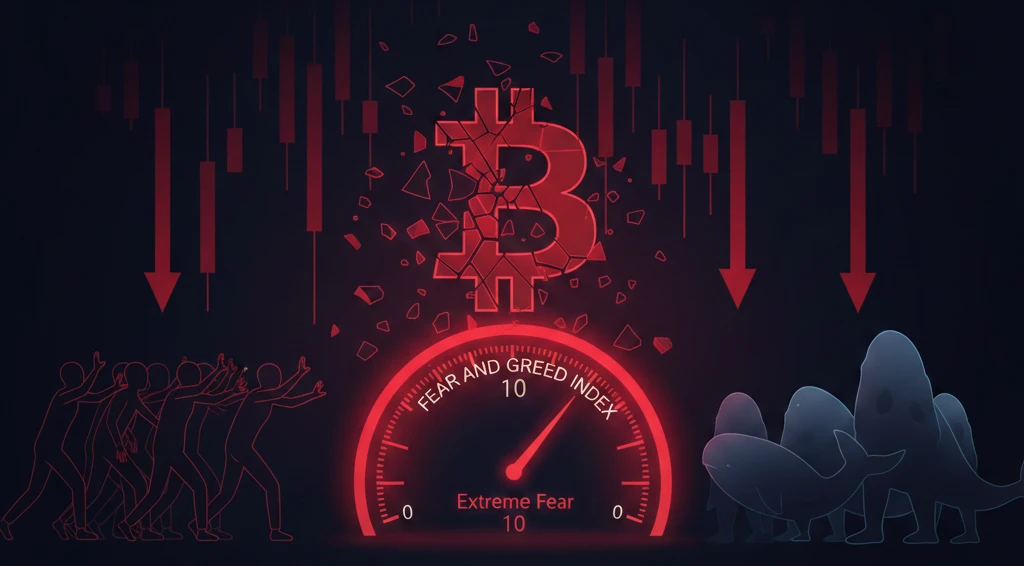
The Bitcoin Fear & Greed Index is a sentiment measurement tool created by Alternative.me. It gives Bitcoin’s current market sentiment a number from 0 to 100.
- 0–24 = Extreme Fear (market is panicking)
- 25–49 = Fear (cautious, negative sentiment)
- 50–74 = Greed (optimistic, buyers active)
- 75–100 = Extreme Greed (euphoria, overheated market)
The index does not measure one thing. It combines six data sources:
- Volatility (25% weight): Compares current Bitcoin volatility to 30-day and 90-day averages. High volatility = more fear.
- Market Momentum / Volume (25%): If volume is high while prices drop, fear score rises.
- Social Media (15%): Measures interaction rates and sentiment from Reddit and Twitter/X. Unusual spikes in negative engagement push the score toward fear.
- Surveys (15%): Weekly polls about market outlook. (This component is currently paused.)
- Bitcoin Dominance (10%): If Bitcoin dominance rises, it often means people are moving from altcoins into Bitcoin as a safer crypto asset — a mild fear signal.
- Google Trends (10%): Tracks search terms like “Bitcoin crash” and “Bitcoin sell.” Rising searches for negative terms = higher fear score.
How to use it: Visit alternative.me/crypto/fear-and-greed-index or check it directly on CoinMarketCap or Glassnode dashboards. The index updates daily. Do not use it as a buy or sell signal on its own — use it as one layer of context alongside price charts and on-chain data.
What NOT to do: Do not treat a reading of 15 as a guaranteed buy signal. There are documented periods — like the 2018 bear market — where the index stayed below 25 for 45 consecutive days while Bitcoin continued falling 40% more. The index tells you mood, not direction.
The cryptocurrency landscape can be overwhelming for newcomers, but understanding the basic taxonomy makes navigation significantly easier. At the foundation, digital assets fall into two primary categories: coins, which operate on their own independent blockchains (like Bitcoin and Ethereum), and tokens, which are built on top of existing blockchain networks. Coins typically function as the native currency of their respective networks and are used for transaction fees and network security, while tokens leverage established infrastructure to create specialized assets for specific applications, governance, or utility. Before making any investment, familiarize yourself with the types of cryptocurrency: coins vs tokens to better assess the technical foundation and potential use cases of any digital asset you’re considering.
How Fast Does Fear Predict Bitcoin Declines? The Predictive Decay Problem
This is one of the most important things most articles about sentiment never explain: fear is a short-term signal, not a long-term one.
Sentiment data has measurable predictive power over Bitcoin’s next 24 hours. But that power decays sharply over time. Research on sentiment-price correlations shows the following approximate decay pattern:
- 1-day predictive correlation: ~0.65–0.70 (strong short-term link between sentiment and next-day price direction)
- 7-day predictive correlation: ~0.30–0.35 (moderate, much weaker)
- 30-day predictive correlation: ~0.10–0.15 (essentially negligible)
What this means is that when the Fear & Greed Index hits 10 today, it is a reasonably reliable indicator that Bitcoin may fall or stay suppressed in the next 24–48 hours. But it tells you almost nothing about where price will be in a month. Macro conditions, on-chain fundamentals, and network activity take over as the dominant factors at longer timeframes.
Practical implication: If you are a short-term trader, sentiment data matters a lot. If you are a long-term holder, use fear readings as psychological context — not as entry timing tools. The correct approach for long-term holders during extreme fear is not to time the exact bottom but to determine whether the fear is sentiment-driven (temporary) or fundamental-driven (structural).
What to do: When fear is high, ask whether the fear is caused by a news event, social media panic, or a liquidation cascade — or whether it reflects a real problem with Bitcoin’s fundamentals (like a critical protocol bug, regulatory ban in a major market, or exchange collapse). Sentiment fear recovers. Fundamental fear can persist.
Entering the crypto market requires understanding the platforms that facilitate buying, selling, and trading digital assets. Cryptocurrency exchanges serve as the gateway between traditional fiat currencies and the digital economy, providing essential services like liquidity, price discovery, wallet custody, and order matching. With global 24-hour trading volumes exceeding $2.5 trillion, these platforms play a critical role in the ecosystem, though not all exchanges are created equal—factors like regulatory compliance, proof of reserves, and transparent custody models should heavily influence your choice of platform. Learn more about selecting a secure trading venue by exploring how cryptocurrency exchanges function, including key considerations around regulation, security, and risk management that every trader should understand.
How Leverage Liquidation Cascades Turn Fear Into Free-Fall
This is the mechanical engine behind Bitcoin’s most violent drops. Here is how it works.
Many traders on exchanges like Bybit, Binance, OKX, and Deribit trade Bitcoin using leverage. Leverage means you borrow money to take a larger position. If you have $1,000 and use 10x leverage, you are controlling a $10,000 Bitcoin position.
The problem with leverage is the liquidation mechanism. If the market moves 10% against a 10x leveraged position, the exchange automatically closes your position and takes your collateral. With 20x leverage, a 5% drop liquidates you. With 50x leverage, a 2% drop is enough.
Here is where the cascade happens:
- Fear enters the market. Prices drop 5%.
- Highly leveraged long positions (traders betting on price going up) start getting liquidated.
- These liquidations are essentially forced sell orders hitting the market simultaneously.
- This extra sell pressure pushes the price down another 3–5%.
- The further price drop triggers a new wave of liquidations from the next level of leveraged traders.
- The cascade repeats, accelerating the drop far beyond what natural selling alone would cause.
During the February 2026 Bitcoin crash, more than $2.5 billion in leveraged positions were liquidated within a 24-hour window. Each wave of liquidations created the conditions for the next wave. What started as a 12% correction accelerated into a 28% drop within 36 hours.
What to do: Before entering any leveraged position, calculate your liquidation price. Never use more than 3x leverage unless you are an experienced professional with clearly defined stop-losses. During high-fear markets (index below 30), reduce leverage or eliminate it entirely.
What NOT to do: Do not add to a losing leveraged position during a fear cascade hoping the price will recover before you get liquidated. This is called “averaging down on leverage,” and it is one of the fastest ways to lose your entire position. Close the position or let your stop-loss execute.
DeFi platforms often advertise eye-catching returns of 15%, 50%, or even 100%, but these numbers require careful scrutiny to understand what you’re actually earning. APY, or Annual Percentage Yield, represents the real rate of return on your crypto assets over a full year, incorporating the power of compound interest—meaning you earn returns not just on your original deposit, but also on the interest you’ve already accumulated. Unlike simple APR calculations, APY gives you the true growth figure assuming rates remain constant, making it the essential metric for comparing passive income opportunities across staking, lending, and yield farming platforms. Before committing your assets to any high-yield protocol, make sure you fully understand what APY is in crypto and the risks that can cause those attractive returns to vanish overnight.
What Happens to Bitcoin’s Order Book During Fear? The Market Microstructure Problem
Bitcoin’s 24/7 trading structure creates a vulnerability that traditional stock markets do not have: there is no circuit breaker, no trading halt, no overnight reset.
When US stock markets get hit by severe panic, trading halts trigger. This gives time for rational decision-making to return. Bitcoin has no such mechanism.
During extreme fear events, professional market makers — entities that provide liquidity by placing buy and sell orders on both sides of the book — start pulling their orders. Why? Because market makers profit from the spread (the gap between the buy price and the sell price). During normal times, that spread might be $10–$50 on Bitcoin. During panic, the risk of being caught holding Bitcoin on the wrong side of a crash is too high, so market makers widen their spreads dramatically — sometimes 300–500% wider — or exit the book entirely.
When liquidity providers disappear, two things happen:
- Slippage increases. A large market sell order that would normally move price by 0.1% might now move it 2–3%.
- Bid-ask spreads widen. You might want to sell at $95,000 but the best available bid is $93,500. The “invisible” cost of panic selling spikes.
This is why Bitcoin drops look so sharp and sudden during fear events. It is not just that more people are selling — it is that the buyers who normally absorb selling pressure have stepped back, so each sell order has a disproportionately large price impact.
What to do: During extreme fear periods, if you need to sell or buy Bitcoin, use limit orders rather than market orders. A limit order lets you set the price you want. A market order executes at whatever price the book shows — which during panic can be significantly worse than what you expect.
What NOT to do: Do not place large market sell orders during a fear cascade. You will receive a worse price than the quoted last trade, sometimes by hundreds or thousands of dollars per Bitcoin.
To appreciate where Bitcoin stands today as a trillion-dollar asset class, one must look back at its remarkable journey from a whitepaper to global phenomenon. Born from the 2008 financial crisis when Satoshi Nakamoto published the landmark paper “Bitcoin: A Peer-to-Peer Electronic Cash System,” the network launched on January 3, 2009, with a genesis block containing a pointed message about bank bailouts. From those early days when developer Hal Finney received the first 10 BTC transaction, through milestones like the famous “Bitcoin Pizza Day” in 2010 when 10,000 BTC bought two pizzas, to its current status as institutional investment vehicle, Bitcoin’s evolution reflects the growing acceptance of decentralized finance. Understanding this trajectory through the history of Bitcoin from 2009 to today provides crucial context for evaluating its future potential and resilience through multiple market cycles
Why Do Whales Accumulate Bitcoin While Retail Investors Panic Sell?
This is one of the most consistent patterns in Bitcoin market history, and most retail investors are unaware it is happening while they are selling.
A Bitcoin “whale” is a wallet holding 1,000 BTC or more. These entities — which include institutional funds, family offices, long-term early adopters, and OTC desks — operate with different psychology and different tools than the average retail trader.
The data across multiple fear cycles shows a consistent pattern:
- During Extreme Fear phases (index below 25): Exchange outflows increase, meaning Bitcoin is moving from exchange wallets to cold storage wallets. This is a buy-and-hold signal — when you buy and move Bitcoin to cold storage, you are not planning to sell soon.
- Retail behavior during the same periods: Exchange inflows increase, meaning retail investors are sending Bitcoin to exchanges — which is typically done before selling.
The two groups are doing opposite things at the same moment.
Why can whales do this while retail cannot? Several reasons:
Risk tolerance: A whale holding 5,000 BTC can absorb a 30% drop in dollar terms because their cost basis may be $10,000–$20,000 per Bitcoin. Their unrealized profit cushion is enormous. A retail investor who bought at $90,000 and sees it drop to $65,000 feels existential portfolio panic.
Information quality: Whales use on-chain analytics tools like Glassnode, CryptoQuant, and Nansen to watch the same on-chain data they are creating. They can see capitulation signals — the moment when the last weak hands have sold — before the price visibly stabilizes.
Liquidity structure: Large buyers often use OTC (over-the-counter) desks to purchase Bitcoin directly from sellers without impacting the exchange price. While retail panic-selling hits the order book and drives price down, institutional buyers are quietly absorbing supply off-exchange.
How to use this insight: Watch exchange balance trends during fear periods. You can track this on Glassnode (glassnode.com) using the “Exchange Balance” metric. If the total amount of Bitcoin held on exchanges is falling during a fear event, it is a signal that larger holders are buying and withdrawing. This does not guarantee a price reversal, but it is a more objective signal than sentiment alone.
How Do Bitcoin ETFs Affect Fear-Driven Declines?
Since the approval of spot Bitcoin ETFs in the United States in January 2024, the market has a new dynamic during fear events.
Spot Bitcoin ETFs — including BlackRock’s IBIT, Fidelity’s FBTC, and others — allow institutional investors and traditional brokerage users to buy Bitcoin exposure without holding actual Bitcoin. But this creates a two-way impact on fear events.
When fear spikes, ETF outflows can amplify selling: If a large institutional holder or pension fund reduces its ETF position during a fear event, the ETF issuer must sell actual Bitcoin on the market to redeem the shares. This creates direct sell pressure from the ETF mechanism itself, adding to the natural panic selling.
But ETF inflows can cushion fear-driven drops: During the February 2026 crash, while GBTC (the Grayscale ETF, which carries higher fees) saw significant outflows, BlackRock’s IBIT recorded net inflows on multiple days during the dip. Large institutional buyers were treating the fear event as an accumulation opportunity through the regulated ETF structure.
This creates a split signal: watch not just total ETF flows but which ETFs are seeing inflows vs. outflows. If lower-fee ETFs with longer-term institutional holders are seeing inflows during a crash, that is a positive underlying signal despite the surface panic.
Where to track ETF flows: BitMEX Research and Farside Investors (farside.co.uk/bitcoin-etf-flow-all-data-table) publish daily ETF flow data.
How Does the Stock Market’s Fear (VIX) Spread to Bitcoin?
The VIX is the CBOE Volatility Index. It measures expected volatility in the S&P 500 over the next 30 days based on options pricing. Traders call it the “fear gauge” of traditional financial markets.
When the VIX spikes — especially above 30 — it signals that professional traders in equities are pricing in high uncertainty. Historically, when this happens, the correlation between Bitcoin and the S&P 500 shifts dramatically.
Under normal market conditions, Bitcoin and the S&P 500 have a moderate correlation of around 0.20–0.30. They move somewhat together but are influenced by very different factors.
During systemic fear events — major financial stress, recession fears, geopolitical crises — that correlation can jump to 0.70–0.90. This means Bitcoin starts moving almost in lockstep with stocks, and often more violently.
Why does this happen?
During market stress, institutional investors face margin calls. A hedge fund that has borrowed money to hold a portfolio of stocks, bonds, AND Bitcoin suddenly needs cash to cover losses elsewhere. They sell what they can sell quickly. Bitcoin, trading 24/7 with high liquidity, is often one of the first assets sold — not because traders dislike Bitcoin specifically, but because it is available and liquid when other markets are closed or illiquid.
This also explains why Bitcoin’s “digital gold” or “safe haven” narrative breaks down during systemic fear events. Gold benefits from flight-to-safety flows. Bitcoin, despite its store-of-value thesis, is still treated as a risk asset by most institutional portfolios, which means it gets sold when risk appetite collapses globally.
What to watch: When VIX rises above 25, start monitoring Bitcoin correlation carefully. If VIX hits 30+ and S&P 500 is dropping, expect Bitcoin to face significant additional pressure regardless of its own on-chain fundamentals.
What Is the Difference Between “Correction Fear” and “Capitulation Fear”?
Not all fear in the Bitcoin market is the same, and treating all fear equally is one of the most common mistakes among both traders and long-term investors.
Correction fear is temporary sentiment panic. It is caused by sharp short-term price drops, often triggered by news events, large liquidation cascades, or negative headlines. The underlying demand for Bitcoin has not changed. Fundamentals are intact. On-chain metrics show that long-term holders are not selling in large volumes. The fear is mostly a surface reaction.
Correction fear typically resolves within days to a few weeks. Once the immediate panic passes, price recovers because the supply-demand fundamentals remain stable.
Capitulation fear is different. It occurs when long-term holders — the people who have held Bitcoin through multiple cycles and typically represent the most committed believers — start selling in large volumes. When they sell, it signals genuine belief that the bear market is deep and long. This type of fear can last months, not days.
How to tell them apart using on-chain data:
The key metric here is Coin Days Destroyed (CDD). Every Bitcoin accumulates “coin days” for every day it sits unmoved in a wallet. When old coins (held for months or years) start moving and being sold, CDD spikes. A massive CDD spike during a price crash is a capitulation signal — old, long-term holders are selling. This is rare but significant.
Another metric is Long-Term Holder Supply. You can track how much Bitcoin is held by addresses that have not moved their coins for 155+ days (Glassnode’s definition of a long-term holder). If long-term holder supply starts declining rapidly during a price drop, capitulation is likely underway.
What to do: During correction fear, patient accumulation and dollar-cost averaging into Bitcoin can be rational. During capitulation fear, exercise more caution. Capitulation bottoms exist, but they are difficult to time, and the market can remain suppressed for extended periods.
How Do Social Media and Algorithmic Amplification Make Fear Worse?
Ten years ago, fear spread through forums and news sites. People read an article, reacted, and the cycle took days to complete. Today, fear spreads in minutes — and platform algorithms are built to accelerate it.
When Bitcoin drops sharply, negative content starts generating more engagement than neutral or positive content. TikTok’s algorithm, YouTube’s recommendation engine, and Twitter/X’s trending mechanism all detect this engagement spike and respond by distributing fear-driven content to more users. More views, more reactions, more sharing — which drives more people to check their portfolio, which drives more selling decisions, which generates more negative content.
This creates a feedback loop between the content ecosystem and market behavior. A drop that might have stabilized at -15% in the pre-social-media era can accelerate to -30% because the algorithmic amplification has now reached millions of retail investors simultaneously with the same message: “Bitcoin is crashing.”
There is also the specific problem of viral crash videos on TikTok and YouTube. Research into multimodal sentiment — studying not just the words but the tone of voice, visual presentation, and emotional framing of video content — shows that visual FUD (fear, uncertainty, doubt) spreads significantly faster than text-based FUD. A creator with a panicked tone and a red price chart in the background can trigger emotional responses in viewers faster than a written article covering the same information.
What to do: During a Bitcoin price drop, deliberately limit your social media consumption. The algorithmic feed during a crash is almost exclusively negative, and it is designed to maximize your emotional engagement, not your rational decision-making. Instead, go directly to objective data sources: Glassnode for on-chain metrics, TradingView for price charts, and Coinglass for liquidation data.
What NOT to do: Do not make trading decisions based on viral social media content during fear events. By the time a crash narrative has reached viral status on TikTok, the immediate price impact has typically already occurred. Acting on viral fear content means you are reacting to information after the market has already processed it — which usually means selling into the bottom.
What Are the Hidden Leading Indicators That Signal Bitcoin Fear Before the Drop?
Most retail investors notice fear after Bitcoin’s price has already fallen significantly. By that point, the panic is already priced in to a large degree. Sophisticated participants watch signals that tend to move before the headline price crash.
1. Bitcoin Options Skew (25-Delta Risk Reversal)
Options are financial contracts that give the right — but not the obligation — to buy or sell Bitcoin at a specific price. Professional traders use options as hedges and speculation tools.
The 25-delta risk reversal measures the difference in implied volatility between out-of-the-money put options (bets that price will fall) and out-of-the-money call options (bets that price will rise). When puts become significantly more expensive than calls, it means sophisticated traders are willing to pay a premium to protect against downside — a leading fear signal.
You can track Bitcoin options data on Deribit (deribit.com) under the “Analytics” section. A risk reversal turning sharply negative (puts more expensive than calls) before a significant price move has historically been an early warning signal.
2. Funding Rates in Perpetual Futures
Perpetual futures are the most popular Bitcoin trading instrument on exchanges like Binance, Bybit, and OKX. They are essentially forever-running futures contracts with no expiry date.
To keep perpetual contract prices aligned with spot Bitcoin prices, exchanges use a funding rate mechanism. When more traders are long (bullish), longs pay shorts every 8 hours. When more traders are short (bearish), shorts pay longs.
When funding rates turn deeply negative — meaning shorts are paying longs — it signals extreme bearish positioning. This can precede or accompany sharp price declines. Funding rates going from positive to sharply negative within 24 hours is a major caution signal.
Track funding rates at Coinglass (coinglass.com) — it aggregates funding rates across all major exchanges.
3. Google Trends for “Bitcoin Crash” and “Bitcoin Sell”
Google Trends data (trends.google.com) shows search volume for specific terms. When searches for “Bitcoin crash,” “Bitcoin sell,” or “Bitcoin worth nothing” spike suddenly, retail panic is entering a new phase. This often leads a broader fear cascade because it reflects people who are not already in the market beginning to notice the crash and potentially entering panic.
4. Mempool Congestion
The Bitcoin mempool is the waiting room for unconfirmed transactions. When fear spikes, many people try to move their Bitcoin simultaneously — to exchanges to sell, or to cold wallets to protect. This flood of transactions causes mempool congestion and rising transaction fees.
A sudden spike in mempool transaction volume combined with rising fees is a secondary signal that large-scale movement is occurring. Track this at mempool.space.
The “Sentiment Trap”: When Extreme Fear Stays Extreme and Bitcoin Keeps Falling
This is a concept almost no mainstream content covers, and it is critically important for anyone planning to “buy the fear.”
During the 2018 Bitcoin bear market, the Fear & Greed Index dropped below 20 in November 2018 and stayed there for 45 consecutive days. During this period, Bitcoin fell from approximately $6,000 to $3,100 — a 48% decline while sentiment was already in extreme fear territory.
This is what is called a sentiment trap: the market looks cheap based on sentiment, feels like it should recover, but continues declining because the selling pressure comes from structural sources — not just temporary panic.
Sentiment traps occur when:
A fundamental fear event is underway: The collapse of a major exchange (like FTX in 2022), a critical protocol vulnerability, or a regulatory crackdown creates sustained fear that is not resolved by time alone.
Leverage is being unwound over weeks: After a major crash, the liquidation cascade does not always end in one day. If the broader crypto ecosystem had extreme amounts of leverage, the unwinding process can take weeks as successive waves of positions are closed.
Bitcoin’s market cycle is in a macro downtrend: Fear-buying works better in bull market corrections than in genuine bear markets. In a bear market, every bounce creates new sellers who were waiting to exit.
How to avoid the sentiment trap:
Do not use the Fear & Greed Index as a buy signal in isolation. Confirm it with:
- MVRV Ratio: The Market Value to Realized Value ratio compares Bitcoin’s current market price to the average price at which all coins last moved. An MVRV below 1.0 means the average holder is underwater — deep value territory. An MVRV between 1.0 and 2.0 during extreme fear is a stronger buy signal than extreme fear alone.
- 200-Week Moving Average: Bitcoin has historically found strong support at its 200-week moving average during bear markets. When extreme fear coincides with price near this average, the risk-reward of long-term accumulation improves significantly.
- Long-Term Holder Supply: If long-term holders are accumulating (their supply increasing) during extreme fear, that is a positive structural signal. If they are distributing (supply decreasing), caution is warranted.
How Does Altcoin Fear Differ from Bitcoin Fear?
When Bitcoin enters extreme fear, altcoins do not just follow — they fall harder, faster, and often recover slower.
This is called the fear waterfall effect. Here is how it works:
When fear hits the crypto market, traders move capital in a predictable direction: out of high-risk altcoins, into Bitcoin, and then potentially out of Bitcoin into stablecoins or off the platform entirely.
Bitcoin actually benefits relatively during early fear phases because it receives the capital fleeing altcoins. This is why Bitcoin Dominance — the percentage of total crypto market cap held by Bitcoin — typically rises during fear events.
For altcoin holders, this creates a double problem. Altcoins fall in dollar terms because people are selling them. But they also fall in BTC terms because Bitcoin is rising relative to everything else. A coin that drops 40% in dollar terms might be down 60% against Bitcoin.
Specific altcoin dynamics during Bitcoin fear:
Ethereum (ETH): As the second-largest crypto asset and the foundation of most DeFi, ETH typically tracks Bitcoin closely but with higher beta (amplified moves). During extreme fear, ETH commonly drops 1.3–1.5x whatever Bitcoin drops.
Solana (SOL) and other high-beta Layer 1s: These face even greater volatility — often 2–3x Bitcoin’s percentage decline during fear events — because they carry higher speculative risk premiums that evaporate first during panic.
Memecoins: During extreme fear, memecoins can lose 70–90% of their value in a matter of days. They have no fundamental floor — no revenue, no utility, no institutional buyers stepping in at specific prices. Their price is purely sentiment-driven, so when sentiment collapses, so does their value.
What to do: If you hold altcoins and a fear cycle is beginning, decide early whether you are a holder through the cycle or whether you want to reduce risk. Waiting until the panic is fully underway to sell altcoins typically means receiving the worst possible prices.
How to Actually Use Fear Signals Practically: A Risk-Managed Framework
This section is not financial advice. It is an educational framework for understanding how sentiment-aware investors approach fear cycles.
Step 1: Identify the fear type
Use the criteria from earlier in this article. Is this correction fear (temporary, sentiment-driven, fundamentals intact) or capitulation fear (structural, long-term holders selling, macro conditions deteriorating)?
Step 2: Confirm with on-chain data
Before acting on fear signals, check three metrics on Glassnode:
- MVRV Ratio (is it near historically significant levels?)
- Long-Term Holder Supply (are they accumulating or distributing?)
- Exchange Balance (is Bitcoin flowing onto exchanges to sell, or off exchanges to hold?)
Step 3: Check derivatives positioning
Visit Coinglass and check:
- Are funding rates deeply negative? (Extreme bearish positioning)
- Is open interest still high? (More liquidations possible)
- Is open interest declining? (Deleveraging underway, volatility may be stabilizing)
Step 4: Size appropriately
During extreme fear, position sizing matters more than entry timing. Rather than trying to buy the exact bottom (which is rarely possible), a more consistent approach is to allocate in stages. For example, if you decide to allocate $5,000 during an extreme fear event, do it in five $1,000 purchases spread over 7–14 days. This is called dollar-cost averaging (DCA), and it removes the pressure of timing the exact bottom.
Step 5: Define your exit conditions before entering
Before buying during fear, decide: under what conditions will I sell? If price drops another 30%, will I hold? If the Fear & Greed Index goes to 5 for 10 consecutive days, what will I do? Having these decisions made in advance removes emotional decision-making during subsequent fear events.
What to do: Treat fear as information — a data point that helps you assess the emotional state of the market, not a guaranteed buy signal.
What NOT to do: Do not use fear as the only signal to buy. Do not invest money you cannot afford to hold through an extended downturn. Do not buy altcoins during extreme Bitcoin fear expecting them to recover first — Bitcoin almost always leads the recovery.
Why the “Fear Means Buy” Rule Works Sometimes and Fails Other Times
The popular contrarian saying — “be fearful when others are greedy and greedy when others are fearful” — is often cited in crypto content as if it is a simple, reliable rule. It is not.
Looking at the historical record:
When fear-based buying worked well:
- March 2020 COVID crash: Bitcoin dropped from $9,000 to $4,000 in three days. Fear index hit extreme lows. Price recovered to $12,000 within 4 months.
- September 2021 China mining ban panic: Fear index dropped sharply. Price recovered and continued to new all-time highs within weeks.
- June 2021 correction: Extreme fear readings preceded a recovery rally.
When fear-based buying failed:
- November 2018 through January 2019: Extended extreme fear while price fell 60% further.
- May–November 2022 (post-Terra/LUNA, post-FTX): Multiple extreme fear periods, each followed by further declines.
The pattern that emerges: fear-based contrarian buying works much better in bull markets than bear markets. In a bull market, fear events are typically corrections within an uptrend. In a bear market, fear events are part of a sustained downtrend, and each recovery attempt attracts new sellers.
Identifying whether you are in a bull or bear market requires looking at higher-timeframe data — specifically the 200-week moving average, long-term holder supply trends, and macro conditions — rather than just the Fear & Greed Index.
Practical Safety Rules for Navigating Bitcoin Fear Events
These are not trading strategies — they are risk management principles for anyone holding or considering Bitcoin during fear periods.
Secure your holdings before panicking about price. If you hold Bitcoin on an exchange and a major fear event is underway, prioritize moving your funds to a hardware wallet (Ledger or Trezor are the established options). Exchange failures during market stress — like the FTX collapse in 2022 — have caused permanent losses for users who left funds on platforms. Withdrawing to self-custody removes counterparty risk regardless of what happens to the price.
Beware of fear-driven scams. During Bitcoin crashes, social media fills with fake “recovery schemes,” fake “official support channels,” fake giveaways, and phishing attempts designed to steal your wallet credentials. Scammers know you are vulnerable and looking for solutions. No legitimate entity will ask for your private keys, seed phrase, or a “small deposit to unlock your funds.” Ever.
Do not use unprotected private key storage during panic. When people panic during a crash, they sometimes make hasty decisions with their wallets — sending to wrong addresses, using clipboard hijacking vulnerabilities, or clicking phishing links while distracted. Slow down on any wallet activity during fear events.
Understand that market recovery is not guaranteed on any timeline. Bitcoin has recovered from every major crash in its history so far, but this does not guarantee future recovery or recovery speed. Anyone telling you exactly when Bitcoin will recover is guessing. Anyone promising specific prices or timelines is either misinformed or dishonest.
Keep enough cash reserves that Bitcoin’s price movement does not threaten your daily life. The most common reason people are forced to sell at the worst time is financial necessity — they need the money for bills, rent, or emergencies. Separating Bitcoin investment money from emergency savings removes this pressure.
Summary: How Fear Creates Bitcoin Declines — The Full Chain
To bring this together: Bitcoin does not crash because of fear alone. It crashes through a specific chain of events that fear initiates and accelerates.
It starts with a triggering event — a negative news story, a macro shock, a large sell order. This creates initial price weakness, which generates cortisol responses in holders. Social media algorithms detect the negative sentiment and amplify it to millions of people simultaneously. Retail investors, experiencing loss aversion 2.5x more intensely than any equivalent gain, begin selling.
This selling triggers liquidation cascades among leveraged traders, forcing billions of dollars in automated sell orders into the market within hours. Market makers respond to the extreme volatility by widening spreads or withdrawing from the order book entirely, reducing liquidity and making each sell order hit price harder than normal.
Meanwhile, cross-market contagion from traditional finance — if stocks are also falling — causes institutional investors to sell Bitcoin as part of broader risk reduction. ETF redemptions add additional sell pressure.
At the bottom of this chain, the Fear & Greed Index registers extreme fear. Whales and institutional buyers are quietly accumulating. Long-term holders are mostly holding. The sentiment, not the fundamentals, has created the price decline.
Understanding this chain does not make Bitcoin investing risk-free. Fear cycles can persist for months. Bottoms are not obvious. Mistakes are expensive. But understanding how the mechanism works — from the neuroscience to the order book to the on-chain data — gives you a framework to separate emotional reaction from rational analysis during the moments when that distinction matters most.
This article is educational content only. Nothing written here constitutes financial advice, investment advice, or a recommendation to buy, sell, or hold any cryptocurrency. All cryptocurrency investments carry significant risk, including the total loss of invested capital. Conduct your own research and consult a qualified financial professional before making investment decisions.