Bitcoin Market Correction vs. Crash
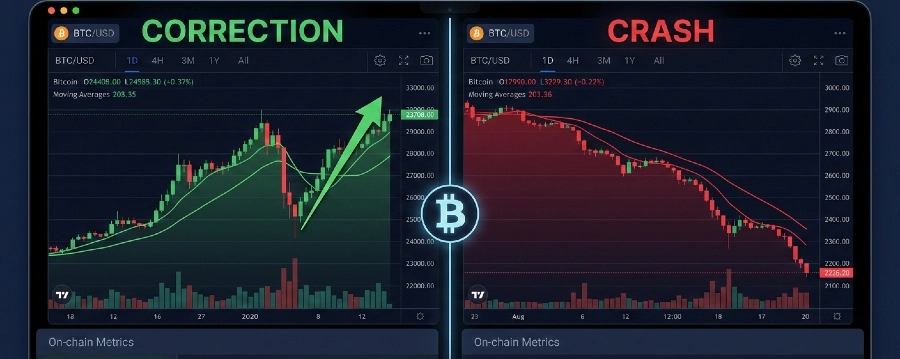
When Bitcoin drops 20% in a week, the chart looks identical whether it’s a temporary correction or the start of a multi-month crash. Every major crash in 2018, 2020, and 2022 started with a price drop that looked ‘normal’ — until it wasn’t.
The price chart tells you what happened. On-chain data and derivatives metrics tell you why it happened and what’s likely to happen next. That distinction is what separates investors who hold through corrections and recover from those who panic sell at the bottom.
Here’s the core problem most guides miss: corrections and crashes are only distinguishable in the middle and end, not the beginning. In the first 48 hours of any sharp drop, the mechanics look similar. What diverges over days and weeks is who is selling, at what cost basis, and whether institutional buyers are absorbing the supply.
The Mechanical Difference: What Actually Causes Each
How a Correction Works Mechanically
A correction is triggered almost entirely by leverage, not by fundamental selling pressure. Here is the exact sequence:
- Bitcoin price rises aggressively. Open interest on perpetual futures climbs — traders are borrowing to go long.
- Funding rates spike above 0.03% per 8-hour period. This means longs are paying shorts to keep positions open — an unsustainable situation.
- A catalyst (bad macro news, a large sell order, a whale exit) pushes price down 5–8%.
- Leveraged long positions hit their liquidation thresholds. Exchanges automatically sell these positions.
- Those forced sales push price down further, triggering more liquidations — a cascade.
- After $500M to $3B in liquidations, the leverage is flushed. Forced selling stops. Price stabilizes or bounces.
What to watch: When open interest drops 20–30% and funding rates reset to near zero or slightly negative, the correction’s mechanical fuel is exhausted. This is usually the recovery signal.
What not to do: Do not sell into the liquidation cascade. The worst price is almost always the moment of maximum forced selling — which ends within hours to days, not weeks.
When analyzing whether Bitcoin is experiencing a correction or crash, understanding the mechanics of large-scale selling is crucial. Institutional investors don’t dump Bitcoin on exchanges like retail traders—they use sophisticated infrastructure including OTC desks, TWAP algorithms, and ETF redemption cycles that create delayed price impacts. For example, when BlackRock’s IBIT sees $157M in outflows, authorized participants like Jane Street must liquidate approximately 1,650 BTC within 24-48 hours, creating predictable selling pressure that retail investors mistake for panic. This mechanical selling often accelerates corrections into crashes through liquidation cascades, making it essential to distinguish between strategic institutional rebalancing and genuine market capitulation.
How a Crash Works Mechanically
A crash involves the same liquidation mechanics at the start, but what follows is different: long-term holders begin distributing into any bounce, exchange reserves stay elevated, and on-chain realized losses dominate for weeks or months.
- The 2022 Bitcoin crash started with Terra/LUNA collapse in May 2022, which wiped $40B in market cap across the ecosystem.
- This forced 3AC (Three Arrows Capital) to liquidate BTC holdings — a structured, large-scale sell-off over weeks.
- Each dead-cat bounce attracted sellers, not buyers, because the fundamental trust in the broader market was broken.
- Bitcoin’s MVRV ratio dropped below 1.0 — meaning the average holder was now underwater — which triggered further panic selling from retail participants who had bought above current prices.
- Long-term holders who had never sold through previous corrections began selling for the first time, signaling genuine capitulation.
The key diagnostic: A crash is happening when realized losses exceed $1B/day for multiple days consecutively, LTH supply starts declining, and MVRV stays below 1.0 for more than 2 weeks.
The critical factor that transforms a Bitcoin correction into a crash is the liquidation cascade mechanism. When leveraged long positions face margin calls, exchanges’ automated liquidation engines convert positions into forced market sell orders within 50-500 milliseconds. In October 2025, this created $19 billion in liquidations within 40 minutes—turning a 5% tariff announcement into a 28% price collapse. Understanding your Estimated Leverage Ratio (ELR) and funding rates helps identify when the market is fragile: when ELR exceeds 0.55 and funding rates stay above 0.03% for 72+ hours, the compressed spring of leverage makes cascades highly probable.
Correction vs. Crash: Side-by-Side Signal Comparison
Use this table as your quick-reference diagnostic. The more signals align in the ‘Crash’ column, the more seriously you should treat the drawdown:
| Signal | Correction | Crash |
| Price drop | -10% to -30% | -40% to -80%+ |
| Duration | Weeks to 3 months | 3 months to 1+ year |
| Funding rates | Briefly negative, then reset | Persistently negative or chaotic |
| Long-term holders | Accumulating (LTH supply rises) | Distributing (panic selling) |
| Exchange inflows | Mild spike then stabilizes | Sustained high inflow (distribution) |
| MVRV ratio | Stays above 1.0 (>1.0 = not underwater) | Drops below 1.0 (market in deep loss) |
| NUPL reading | 0.25–0.5 (belief/hope zone) | Below 0 (capitulation zone) |
| Liquidations | Isolated spikes, clear quickly | Cascading, multi-day deleveraging |
| Recovery pattern | V-shape or short consolidation | Drawn-out base building over months |
The 4-V Framework: Real-Time Classification in Under 5 Minutes
Before you make any decision — hold, buy more, hedge, or sell — run through these four checks. This takes less than 5 minutes using free tools (CoinGlass, Glassnode public, TradingView).
| Factor | Correction Reading | Crash Reading |
| Velocity | < 5% drop per 24h | > 8–10% drop per 24h continuously |
| Volume | Spike then fade | Sustained panic volume for 3+ days |
| Volatility (IV) | Brief IV spike, returns to baseline | IV stays elevated > 1 week |
| Validation (on-chain) | LTH accumulating, STH shaken out only | LTH distributing, realized loss dominates |
How to Check Each Factor
1. Velocity — CoinGlass or TradingView
Do: Open Bitcoin’s hourly or 4-hour chart. Measure the percentage drop from local high to current price within a 24-hour window.
Don’t: Look only at daily candles. A 6% drop that happens in 2 hours is mechanically very different from the same 6% spread over 24 hours — the former is a leverage flush, the latter could be sustained distribution.
2. Volume — TradingView (on-exchange volume)
Do: Compare current selling volume to the 30-day average. A correction spike is typically 2–3x average for 1–2 days, then normalizes.
Don’t: Judge volume by a single spike. Panic volume that sustains at 2x average for 4+ days is a crash warning, not a correction.
3. Volatility — Deribit or TradingView IV charts
Do: Check Bitcoin’s 30-day implied volatility (IV). In a correction, IV spikes briefly then mean-reverts within days. In early crash conditions, IV stays elevated and term structure flattens or inverts.
Don’t: Ignore the options market. Most retail investors do — which is exactly why they’re surprised when the ‘volatility crush’ after a correction is followed by a new wave of selling.
4. Validation — Glassnode (free metrics)
Do: Check MVRV Ratio (free on Glassnode). If it’s above 1.5, the market still has structural support. Check Exchange Reserve flow — are coins moving to exchanges (selling signal) or away from exchanges (accumulation)?
Don’t: Rely on social media sentiment as your on-chain proxy. Twitter and Reddit amplify the emotion of whichever direction is most dramatic. The blockchain is emotionless.
Behavioral economics plays a decisive role in determining whether Bitcoin stabilizes during a correction or accelerates into a crash. When the Fear & Greed Index drops below 25 (Extreme Fear), cortisol-driven panic triggers loss aversion 2.5x more intense than equivalent gains—causing retail investors to sell at cycle lows while whales accumulate. However, not all fear is equal: “correction fear” resolves within days as fundamentals remain intact, while “capitulation fear” involves long-term holders distributing coins—signaling structural damage. Monitoring Coin Days Destroyed (CDD) and Long-Term Holder Supply helps distinguish temporary sentiment panics from genuine bear market capitulation, preventing the costly mistake of selling into algorithmically-amplified fear cascades
The 3 On-Chain Metrics That Separate Corrections from Crashes
1. MVRV Ratio — The Most Reliable Single Indicator
MVRV stands for Market Value to Realized Value. It compares Bitcoin’s current market cap to the realized cap — the aggregate cost basis of all coins on the network.
What it tells you: If MVRV is 2.0, the average holder has a 100% unrealized profit. At 1.0, the average holder is at breakeven. Below 1.0, the average holder is at a loss.
Historical crash validation:
2. NUPL — Reading the Emotional State of the Market
NUPL (Net Unrealized Profit/Loss) shows the percentage of Bitcoin’s market cap that is in unrealized profit or loss. It’s a crowd psychology indicator built from on-chain data.
The zones you need to know:
- Above 0.75: Euphoria — this is where you reduce exposure, not add to it
- 0.50 to 0.75: Belief — mid-bull market, healthy
- 0.25 to 0.50: Optimism/Hope — correction territory, normal
- 0 to 0.25: Fear/Anxiety — late-stage correction or early crash warning
- Below 0: Capitulation — historical bottom territory
What corrections look like: NUPL drops from 0.5 to 0.2 range during the selloff, then recovers. The majority of holders stay in profit.
What crashes look like: NUPL crosses into negative territory and stays there. The 2022 crash pushed NUPL to -0.16, the deepest reading since 2019.
3. Exchange Reserve Flow — Following the Actual Supply
When Bitcoin holders plan to sell, they move coins from cold storage to exchange wallets. Watching exchange reserves tells you whether supply pressure is rising or falling.
Correction signal: Exchange reserves spike briefly (within 24–72 hours of the drop), then start declining again as buyers absorb supply and long-term holders move coins back to cold storage.
Crash signal: Exchange reserves remain elevated for weeks. Each attempted bounce is met with more coins flowing to exchanges, meaning sellers are using rallies to exit — classic distribution.
Hidden advantage most beginners miss: When exchange reserves are declining even while price is flat or slightly down, it means sophisticated buyers are absorbing supply quietly. This often precedes the next leg up by 2–6 weeks.
Navigating Bitcoin’s volatility requires understanding liquidity risk—the hidden factor that turns corrections into crashes. When market makers detect elevated volatility, they withdraw from order books or widen spreads 300-500%, creating “liquidity vacuums” where forced sell orders disproportionately crush price. The Repo Market crisis and DXY strength create macro headwinds that compound this fragility. During the 2025-2026 correction from $126K to $60K, the $100K psychological level coincided with the 50-week EMA—failure here would have signaled trend reversal rather than cyclical correction. Strategic investors use this framework to identify when “despair, depression, and anger” indicate contrarian accumulation zones versus genuine structural breakdowns.
Why Corrections Turn Into Crashes: The Liquidation Cascade Problem
This is the mechanism that most educational content skips, and it’s the one that costs retail investors the most money.
The Cascade Sequence — Step by Step
Step 1 — High leverage builds: Bitcoin’s open interest rises above its 90-day average. Estimated Leverage Ratio (ELR) climbs above 0.55. Funding rates stay above 0.03% per 8 hours. These three conditions together create a fragile market.
Step 2 — Initial trigger: A large sell order, negative news, or macro event drops price 5–8%.
Step 3 — First wave of liquidations: Exchanges automatically liquidate the most leveraged long positions. On a normal day, this might be $200–500M. On an overleveraged day, it can be $1–3B.
Step 4 — Stop-loss clusters: Market makers are aware of where retail stop-losses cluster (usually just below key support levels). Price being pushed through these levels triggers a second wave of forced selling — not from liquidations, but from stop-loss orders.
Step 5 — Decision point: If this is a correction, the selling exhausts itself here. Buying pressure absorbs the supply and price stabilizes. If this is the start of a crash, a new round of negative news, additional liquidations from other assets (altcoins, DeFi), or institutional deleveraging keeps pushing price down.
ETF Flows and the Retail Confusion Problem
Since Bitcoin spot ETFs launched in January 2024, retail investors have been confused by a pattern: large ETF outflows don’t always result in dramatic price crashes. Understanding why is important for not making panic-driven decisions.
To classify current market action as correction or crash, examine the three primary drivers: Federal Reserve policy creating risk-off sentiment, institutional ETF plumbing mechanics, and leverage-induced liquidation cascades. When interest rates remain elevated, the dollar strengthens, and cash becomes “expensive,” Bitcoin faces macro headwinds—but these typically produce 10-20% corrections rather than 50% crashes unless amplified by derivatives leverage. The ETF redemption machine creates unique dynamics: $100M in outflows can trigger $400-600M in derivatives liquidations through multiplier effects, as thin order books absorb poorly during stress. Distinguishing between these mechanical pressures and fundamental breakdowns is essential for proper market classification and response strategy.
How ETF Authorized Participants Actually Work
BlackRock’s IBIT and Fidelity’s FBTC don’t buy Bitcoin directly every time someone purchases shares. They use Authorized Participants (APs) — firms like Jane Street and JPMorgan — who can create or redeem ETF shares through an arbitrage mechanism.
When ETF outflows occur:
- An AP redeems shares and receives Bitcoin from the ETF custodian (Coinbase in most cases).
- The AP can then sell that Bitcoin on-market, or hedge it using CME futures, or hold it for later.
- The actual selling pressure may be delayed, hedged, or distributed over days — not immediate.
What this means practically: A $500M ETF outflow headline does not equal $500M of immediate Bitcoin sell pressure. It may equal $200M of actual selling spread over 2–3 days, with the rest hedged or offset.
What not to do: Do not treat ETF flow headlines as direct price prediction signals. Track Coinbase exchange outflows (OTC desk activity) and CME basis rates together to get a more accurate picture of institutional selling.
What to Do at Each Drawdown Level: Your Action Framework
The following framework is not financial advice — it is a logical structure for applying the signals covered above. Adjust based on your own risk tolerance and investment timeline.
At -10% to -20% Drawdown
- Check MVRV. If above 1.5: high probability correction. No action required unless you’re heavily leveraged.
- Check funding rates on CoinGlass. If they’ve gone negative: leveraged longs are being flushed out. This is healthy — the market is self-correcting.
- Do: Consider this a potential DCA entry point if your conviction in Bitcoin’s long-term trajectory is intact.
- Don’t: Add leverage in a falling market even if you believe it’s a correction. If you’re wrong and it’s a crash, leverage accelerates losses.
At -20% to -35% Drawdown
- Run the full 4-V Framework. Check all four indicators before making any decision.
- Check NUPL. If it’s approaching 0.0 (the fear/capitulation boundary), you are near historical correction bottoms.
- Check exchange reserves. If they are declining: buyers are absorbing supply. Accumulation is likely underway.
- Do: If MVRV stays above 1.0, this is the zone where long-term investors historically build large positions.
- Don’t: Check the price every 30 minutes. Frequent price checking during high-volatility periods leads to emotional decisions that override your prepared framework.
At -35%+ Drawdown — Crash Territory Evaluation
- Check MVRV. If it has dropped below 1.0: the average holder is now at a loss. Crash dynamics are in play.
- Check LTH supply (Glassnode). If long-term holders are actively selling (supply declining): this is genuinely different from a normal correction.
- Check realized losses (Glassnode). If daily realized losses exceed $1B and sustain for a week: you are in confirmed crash territory.
- Do: Reduce exposure to your target floor position. Preserve capital for lower entry points. Set calendar-based DCA triggers at -50%, -60%, -70% from the peak.
- Don’t: Try to call the exact bottom. No indicator does this reliably. The goal in a crash is capital preservation and systematic re-entry, not perfect timing.
The 5 Most Common Mistakes Investors Make During Corrections
Mistake 1 — Treating volatility as meaning: A 15% drop in Bitcoin is statistically normal. Bitcoin’s average annual volatility has been 60–80%. A 15% move in a 60-volatility asset is not a signal — it’s noise. Do not assign narrative to normal statistical variation.
Mistake 2 — Using 30-minute price alerts as your data feed: Short timeframes amplify emotional response. The same price action that looks terrifying on a 1-hour chart looks like a small wick on a weekly chart. Before making any portfolio decision, look at the weekly chart first.
Mistake 3 — Confusing paper losses with realized losses: You only lose money when you sell. A Bitcoin correction from $100K to $70K is a $30K paper loss per coin. It becomes a real loss the moment you sell. Long-term investors who held through every correction in Bitcoin’s history have never had a 4-year period end in negative returns.
Mistake 4 — Panic selling into maximum liquidity: The worst time to sell is when everyone else is also selling. The liquidation cascade creates the lowest prices, the widest bid-ask spreads, and the highest slippage. If you haven’t defined your exit conditions before the drop, you will almost certainly sell at the worst possible time.
Mistake 5 — Waiting for certainty before buying back in: By the time it’s ‘obvious’ that a correction has ended, price has already recovered 20–30%. The highest-conviction accumulation zones are also the most uncomfortable — because they look like the beginning of a crash, not the end of one.
Hidden Advantages During Corrections That Beginners Miss
1. Funding Rate Resets Reduce Your Cost to Hold Perpetual Positions
If you use perpetual futures or leveraged products (and you should only do so with capital you can afford to lose entirely), negative funding rates during corrections actually pay you to hold long positions. When funding drops to -0.05% per 8 hours, shorts are paying longs to remain open. This is a hidden yield on leveraged long positions opened during panic conditions.
2. On-Chain Data Is a 24/7 Real-Time Edge
Unlike stock markets, Bitcoin’s entire transaction history is public and real-time. Glassnode, CryptoQuant, and Santiment publish free metrics that institutional equity traders don’t have access to for their assets. A retail Bitcoin investor willing to spend 20 minutes reading on-chain data has informational access that is genuinely equivalent to a hedge fund analyst in traditional markets.
3. Corrections Reset Funding Rates — Reducing the Cost of the Next Bull Run
Each correction that flushes leveraged positions sets up the next run with a cleaner, more sustainable leverage structure. The post-correction market tends to be more spot-driven and less prone to violent swings. Investors who accumulate during corrections benefit from both the lower entry price and the lower volatility of the subsequent recovery phase.
4. Tax-Loss Harvesting Opportunities (Jurisdiction-Dependent)
In many tax jurisdictions, selling Bitcoin at a loss and immediately buying back (or buying a different crypto asset) allows you to realize a capital loss for tax purposes while maintaining market exposure. This is a mechanical advantage that only exists during corrections and crashes. Consult a tax professional for your specific situation — but don’t ignore this lever entirely.
Real Case Studies: Corrections vs. Crashes in Bitcoin’s History
March 2020 — Classic Sharp Correction
Price dropped from $9,000 to $3,800 in 48 hours — a 58% decline that looked catastrophically like a crash.
- MVRV: Dropped briefly to 0.88 but recovered above 1.0 within 10 days
- LTH behavior: Long-term holders did not increase distribution — they held
- Exchange reserves: Spiked but normalized within 2 weeks
- Recovery: Price returned to $9,000 within 60 days and reached $65,000 by April 2021
Verdict: Structural correction driven by macro panic (COVID), not Bitcoin-specific breakdown. The on-chain data confirmed this within 2 weeks.
May–November 2022 — Confirmed Crash
Price fell from $47,000 in January 2022 to $15,500 by November 2022 — a 67% decline over 10 months.
- MVRV: Dropped below 1.0 in June 2022 and stayed there for 6 months
- NUPL: Reached -0.16, the deepest reading since the 2019 bear market
- LTH behavior: Long-term holders began distributing in May–June 2022, the first genuine LTH selloff since 2018
- Catalyst: Terra/LUNA collapse ($40B market cap destroyed) → 3AC insolvency → FTX collapse — three sequential structural failures
Verdict: This was a crash. The signal was MVRV below 1.0 sustained for weeks, combined with LTH distribution. Anyone who recognized these signals in June 2022 had 5+ months of warning before the final FTX bottom.
The 5-Signal Bottom Checklist: How to Identify Recovery Before the Crowd Does
Use this checklist during any significant drawdown. When 4 or more of these align, historical data suggests you are at or very near a correction bottom (not necessarily a crash bottom, which requires additional structural repair).
- MVRV above 1.0 and rising — Average holder is back in profit territory
- Funding rates negative-to-neutral — Leverage flush complete, market is neutral or slightly short
- Exchange reserves declining — Supply is leaving exchanges (accumulation signal)
- LTH supply stable or rising — Long-term holders are not selling; they’re accumulating
- Open interest 20%+ below peak — Leverage has been substantially removed from the system
| Important caveat: This checklist identifies correction bottoms more reliably than crash bottoms. In a crash (MVRV sustained below 1.0, LTH distributing), all five signals may appear prematurely before a second or third leg down. Always weight MVRV and LTH behavior most heavily. |
Summary: The Practical Decision Framework
When Bitcoin drops sharply, your first move is not to check price — it’s to check data. Price tells you what happened. Data tells you why and what’s coming next.
The four questions to answer in sequence:
- Is MVRV above or below 1.0? (Above = correction likely. Below and sustained = crash possible)
- Are long-term holders accumulating or distributing? (Glassnode LTH supply metric)
- Have funding rates reset toward zero or negative? (CoinGlass — leverage flush completion signal)
- Are exchange reserves declining after the spike? (Buyers absorbing supply = recovery signal)
If you can answer those four questions with on-chain data, you will make better decisions than the majority of retail participants who are responding purely to price movement and social media sentiment.
Corrections are the price of admission for being invested in the highest-performing asset of the last decade. Crashes are rarer, longer, and recoverable — but only for those who managed risk before the drop, not during it.